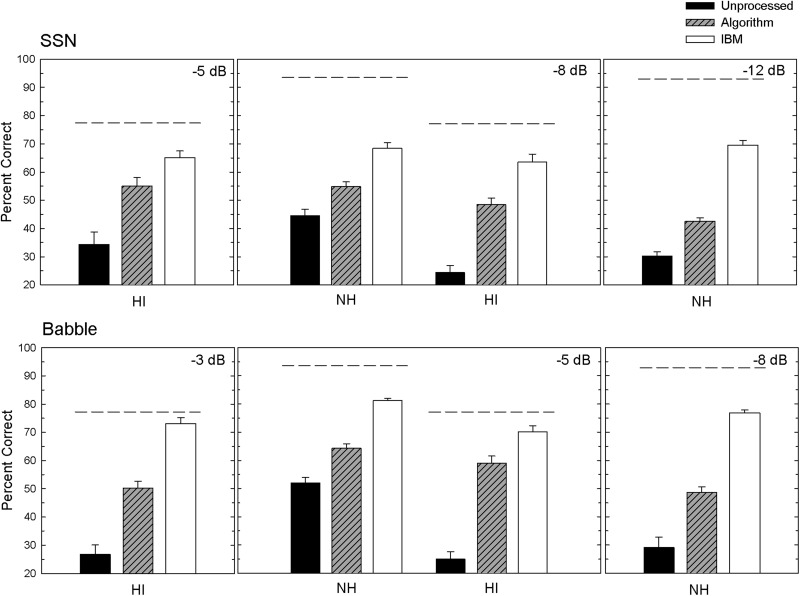
FIG. 3.
Group mean recognition scores and standard errors for VCVs presented in SSN (top panels) and babble (bottom panels), at the SNRs indicated. Scores are presented separately for HI and NH listeners. The three columns reflect scores in unprocessed speech in noise, speech extracted by algorithm processing, and speech extracted by IBM processing. The dashed lines represent recognition of unprocessed speech in quiet for HI (SE = 2.12) and NH listeners (SE = 1.09).

