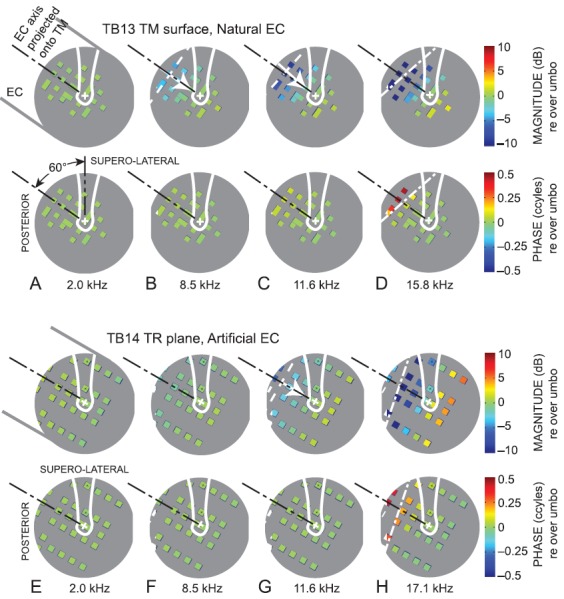
FIG. 2.

Sound pressure maps at representative frequencies generated from (A)–(D) measurements over the TM in ear TB13 (right ear) with a natural EC and (E)–(H) measurements in the TR plane in ear TB14 (right ear) with an artificial EC, normalized by sound pressure at or near the umbo: (A),(E): 2.0 kHz; (B),(F): 8.5 kHz; (C),(G): 11.6 kHz; (D) 15.8 kHz; (H) 17.1 kHz. The viewpoint is normal and lateral to the TR plane as in Fig. 1(E), but rotated to orient the manubrium toward the top of the page (supero-lateral). The umbo is marked by “+,” and the manubrium is outlined in white. Sound enters from the EC 60° postero-superior to the umbo; see (A). The projection of the EC axis on the TM or TR plane is shown by the black dotted-dashed line. Each colored square denotes a measurement location; its size is approximately equal to the microphone receptive field (∼0.5 mm dia.). The gray background (no measurements) is about 8 mm in diameter and approximates the TM. (Top) magnitude; (bottom) phase; color scales at right. At 8.5 kHz (B) and 11.6 kHz (C),(F), a sound pressure gradient is evident (white arrow from low to high sound pressure), which is perpendicular to a sound pressure isobar (white dashed line). At 15.8 kHz (D) and 17.1 kHz (H), a nodal line (white dotted-dashed lines) can be identified by the line of minimum pressure magnitude (top) and 0.5-cycle phase step at the same location (bottom).
