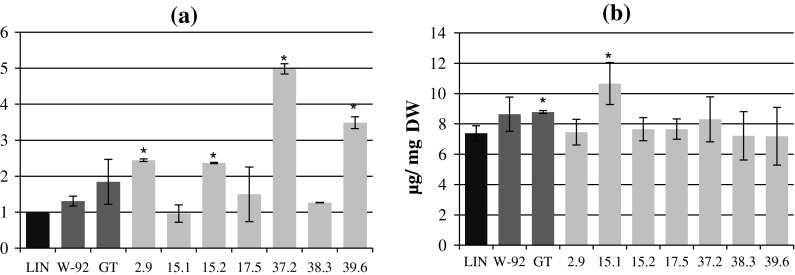
Fig. 1.
a Analysis of the flavonoid levels in the green parts of the W92 × GT, control (LIN) and parental (W92, GT) plants. The procedure is described in the “Materials and methods” section. The results are the mean values ± SD of three independent experiments (n = 3, p < 0.05) and are presented in relation to the values obtained for the control plants (where the values were 1). b The content of phenolic compounds in the green parts of the W92 × GT, control (LIN) and parental (W92, GT) plants. The assay was performed using the Folin–Ciocalteu method. The procedure is described in the “Materials and methods” section. The results are the mean values ± SD of three independent experiments (n = 3). *Statistically significant difference compared to LIN at p < 0.05. DW dry weight. a Flavonoids, b total phenolic compounds

