
Figure 4.
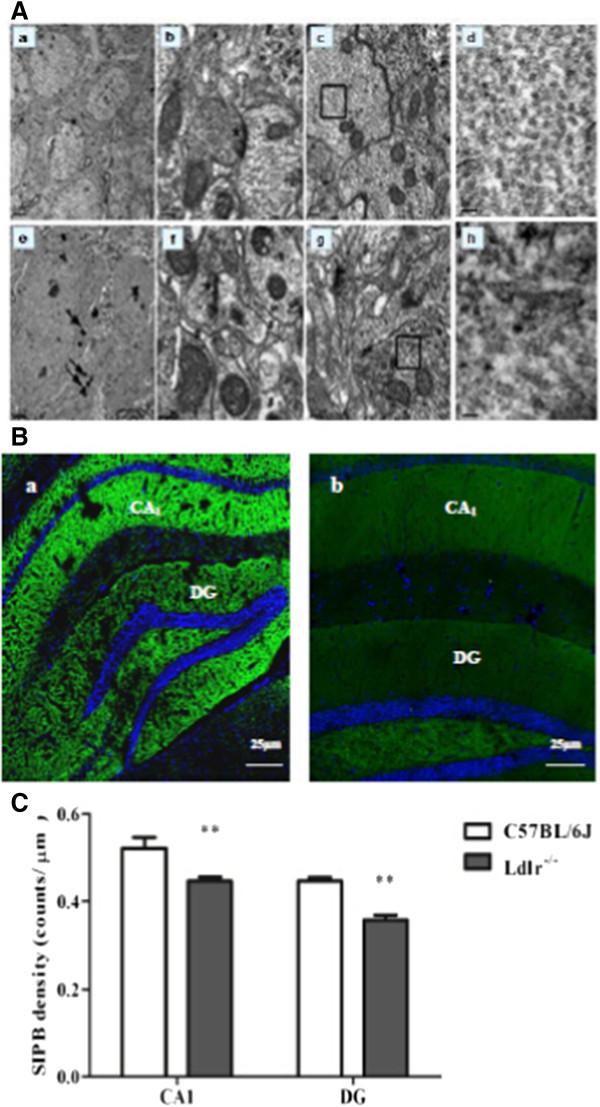
Pathological changes in the hippocampus. A: Electron microscopic examination of the DG stratum radiatum. The data of C57BL/6 J mice shown in a-d are ultrastructural analyses of DG general tissue (a), mitochondrial and synapse ultrastructure (“*” in b), neurofibrils (“□”in c) which is amplified in (d). the data of Ldlr-/- mice shown in e-h are glial cell lipid deposition (“→”in e), ultrastructural loose arrangement and oedema (“#”in f), a decrease in synaptic vesicles (“*” in f) , and sparse neurofibrils (“□”in g) which is amplified in (h). Scale bar = 2 μm in a and e; 0.2 μm in b, c, f and g; 0.04 μm in d and h. B: Density of synaptophysin-immunoreactive presynaptic boutons (SIPBs) in the hippocampus of Ldlr-/- mice. A representative image of the hippocampus of a C57BL/6 J mouse (a) and Ldlr-/- mouse (b) at 20 × magnification is shown. Quantitative data showing a significant decrease in SIPBs in both the CA1 and DG subregions in Ldlr-/- mice (C). Scale bar = 25 μm in a and b. **P < 0.01 for Ldlr-/- vs. C57BL/6 J mice.