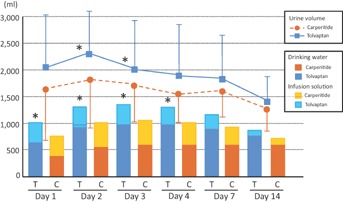
Figure 2.

Comparisons of trends in urine volume and total volume of water intake (drinking water and infusion solution) between tolvaptan (n = 53) and carperitide groups (n = 53). *P < .01 versus carperitide group at the same day. T, tolvaptan group; C, carperitide group.
