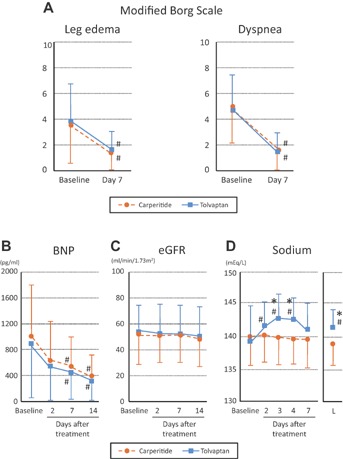
Figure 3.

Comparisons of trends in Borg Scale (A), plasma B-type natriuretic peptide (BNP) (B), estimated glomerular filtration rate (eGFR) (C), and serum sodium level (D) between tolvaptan (n = 54) and carperitide (n = 55) groups. L, Last day of drug administration: *P < .05 versus carperitide group at the same day. #P < .001 versus baseline of same group.
