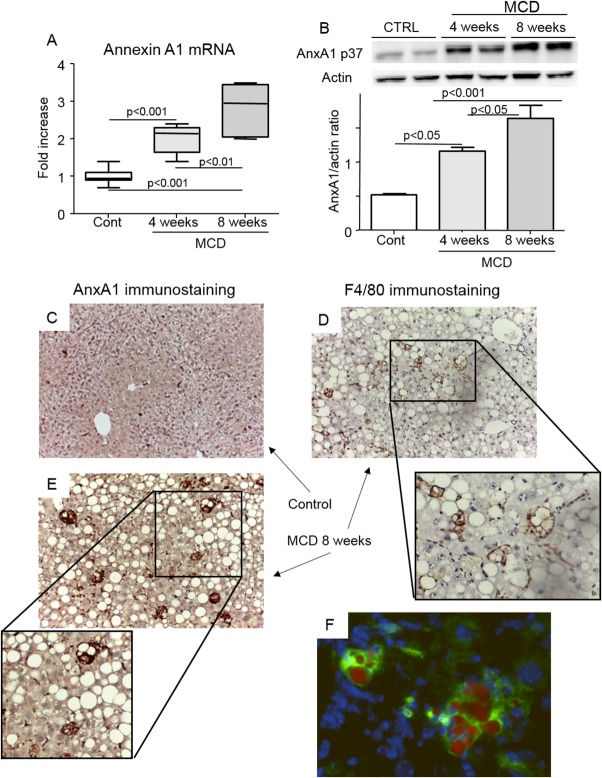
Fig 1.
Hepatic AnxA1 expression in mice with NASH. Mice were fed an MCD diet over an 8-week period. (A and B) AnxA1 mRNA and protein levels, as measured by RT-PCR and western blotting analyses, respectively, in liver extracts of mice receiving control or MCD diet. Hepatic mRNA data are expressed as fold increase over control values after normalization to the β-actin gene. Data are from 8-12 animals per group; boxes include the values within 25th and 75th percentile, whereas horizontal bars represent the medians. The extremities of the vertical bars (10th-90th percentile) comprise 80% of the values. Statistical differences were assessed by one-way ANOVA test with Tukey's correction for multiple comparisons. (C and D) Localization of AnxA1 expression by IHC in liver of MCD-fed animals (magnification, 400×). (E) Detection of macrophages positive for F4/80 immunostaining (magnification, 400×). (F) Colocalization of AnxA1 in macrophages containing lipid vacuoles was evidenced by double staining of frozen liver sections with the lipid dye, Oil Red O (red), and anti-AnxA1 Ab (green immunofluorescence; magnification, 400×). Cell nuclei were courterstained with 4′,6-diamidino-2-phenylindole. Images are representative of 3-4 distinct samples.

