
Fig 2.
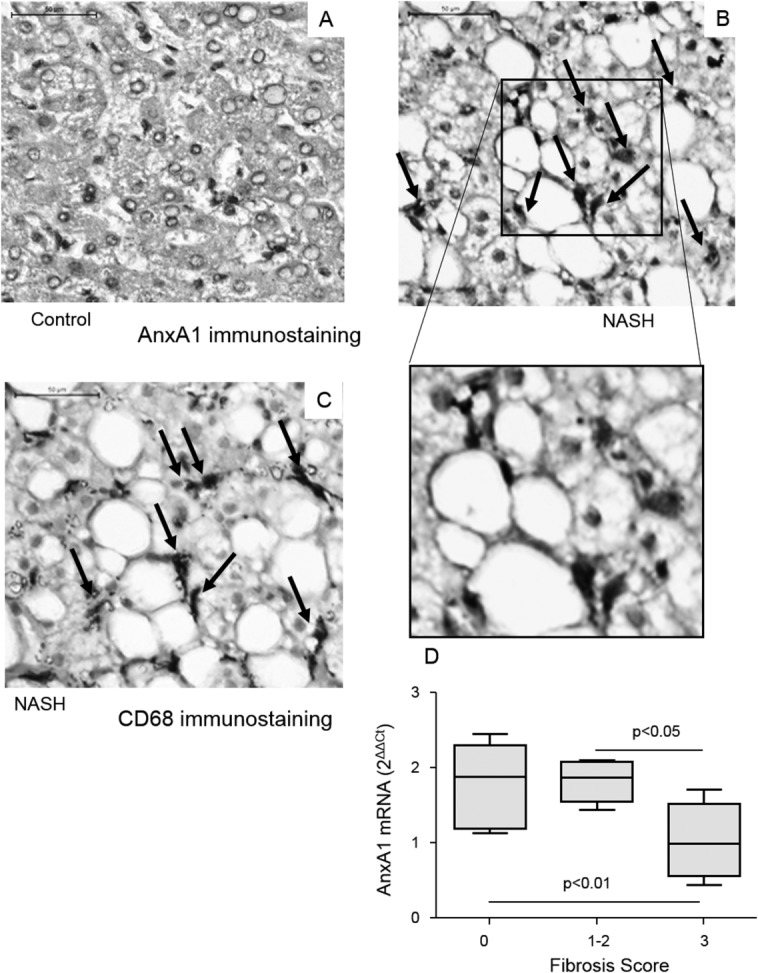
AnxA1 expression in human livers with or without NASH. AnxA1 detection by IHC in liver specimens from control individuals (A) and NASH patients (B). CD68-positive macrophages (from the same NASH patient; C) (magnification, 400×). Control liver samples refer to surgical resections for hepatic metastasis of colon carcinoma. (D) AnxA1 mRNA was measured in liver biopsies of 28 NASH patients using RT-PCR and normalized to that of β-actin. Boxes include the values within 25th and 75th percentile, whereas horizontal bars represent the medians. The extremities of the vertical bars (10th-90th percentile) comprise 80% of the values. The extent of liver fibrosis was scored according to Kleiner et al.12