
Fig 4.
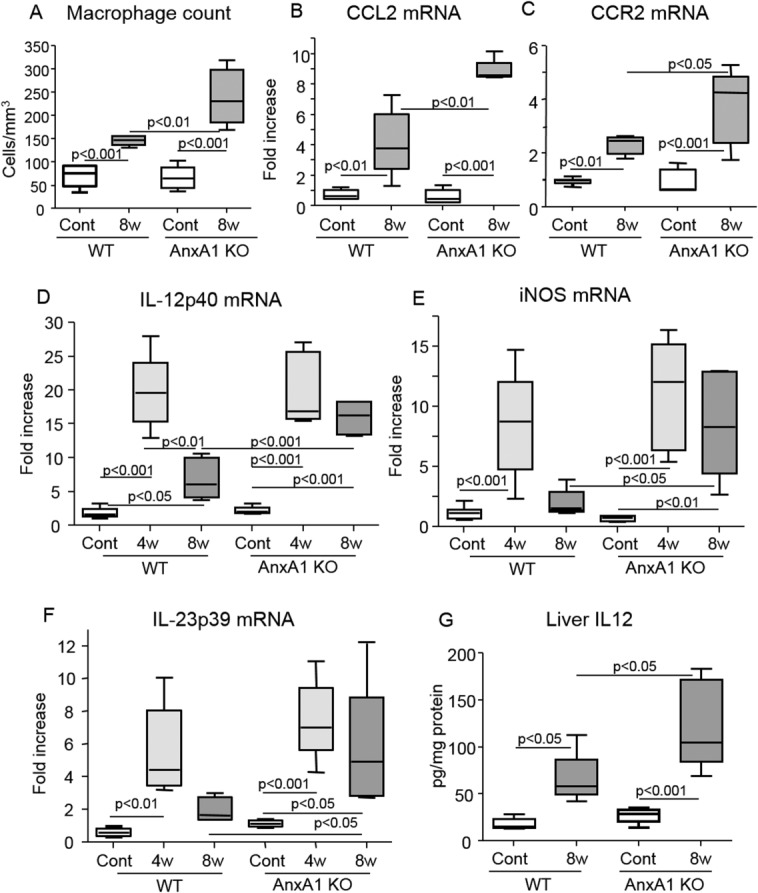
AnxA1 deficiency promotes liver macrophage recruitment and activation. WT and AnxA1 KO C57BL/6 mice were fed the MCD diet up to 8 weeks. (A) Macrophage counts after immunostaining with anti-F4/80 Ab. (B-F) Liver mRNA levels for CCL2, CCR2, and the macrophage M1 activation markers, IL-12p40, IL23p19, and iNOS, as measured by RT-PCR. Data are expressed as fold increase over control values after normalization to the β-actin gene. (G) Liver IL-12 protein content as determined in the same animals. In all cases, values refer to 8-12 animals per group and boxes include the values within 25th and 75th percentile, whereas horizontal bars represent the medians. The extremities of the vertical bars (10th-90th percentile) comprise 80% of the values. Statistical differences were assessed by one-way ANOVA test with Tukey's correction for multiple comparisons.