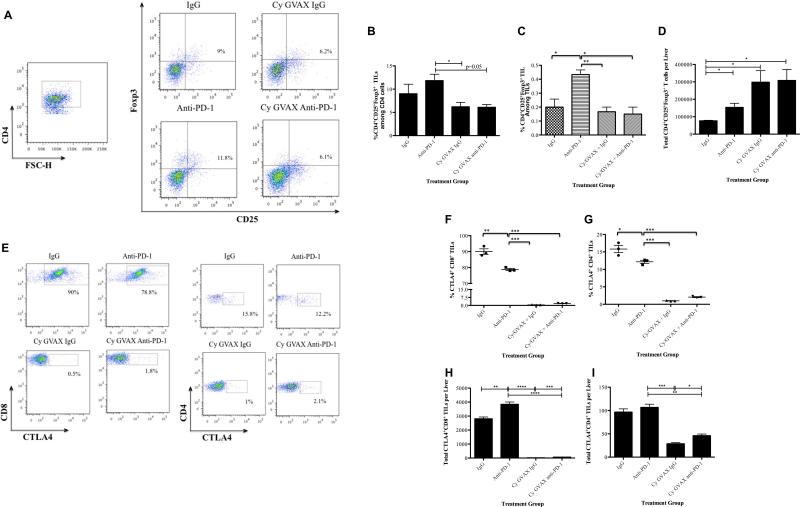
Figure 5. Cy/GVAX therapy with αPD-1 blockade overcomes immunosuppressive pathways.
Following hemispleen implantation of Panc02 cells, tumor-bearing mice were treated with Cy (100 mg/kg) on day 3, GVAX on day 4, 7 and IgG/αPD-1/αPD-L1 (5 mg/kg IP) on day 3, 6, 10. Mice were sacrificed on day 13. (A) Fluorescence-activated cell sorting (FACS) density plot of CD4+CD25+Foxp3+ Tregs in TILs. (B) Histogram showing the percentage of CD4+CD25+Foxp3+ Tregs in CD4+ TILs. (C) Histogram showing the percentage of CD4+CD25+Foxp3+ Tregs in all TILs. (D) Histogram showing the total number of CD4+CD25+Foxp3+ Tregs infiltrating the tumors. (E) Representative FACS analysis of CTLA-4+CD8+ T cells in TILs. (F) Histogram showing the percentage of CTLA-4+CD8+ T cells within CD8+ T cells. (G) Histogram showing the percentage of CTLA-4+CD4+ T cells within CD4+ T cells. (H) Histogram showing the total number of CTLA-4+CD8+ TILs. (I) Histogram showing the total number of CTLA-4+CD4+ TILs. Each experimental group consisted of five mice, pooled and analyzed individually in triplicates. Data represent mean ± SEM from one representative experiment that was repeated at least twice. *p<0.05, **p<0.01, ***p<0.001. IgG, hamster IgG; TIL, tumor infiltrating lymphocytes

