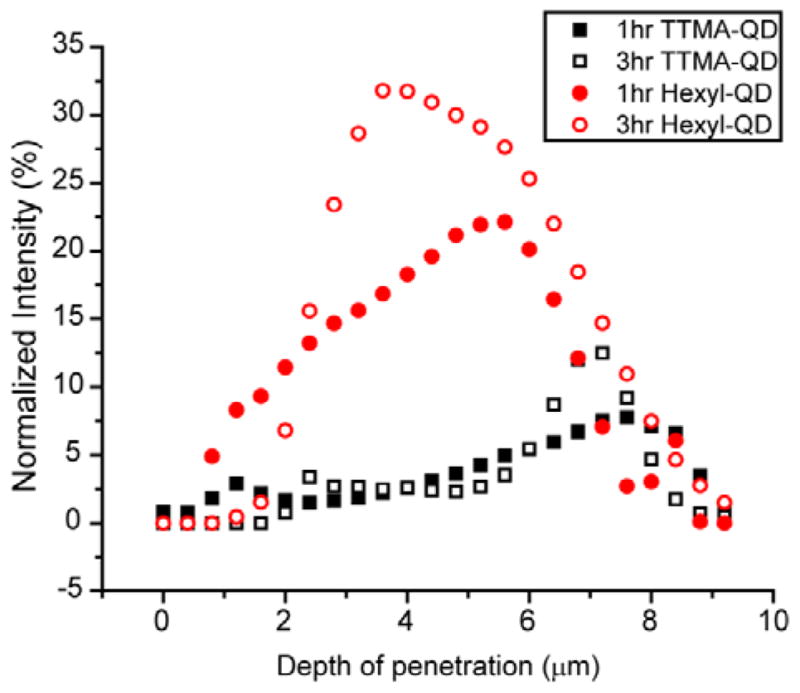
Fig. 3.

Integrated intensity of TTMA-QD and Hexyl-QD and biofilm after 1h and 3h hr incubation. The y-axis, normalized intensity, is the integrated QD intensity normalized by the integrated biofilm intensity. The x-axis is the depth of penetration of biofilms, where 0 μm represents the top and ~7.2 μm represents the bottom. The data are average of three image stacks.
