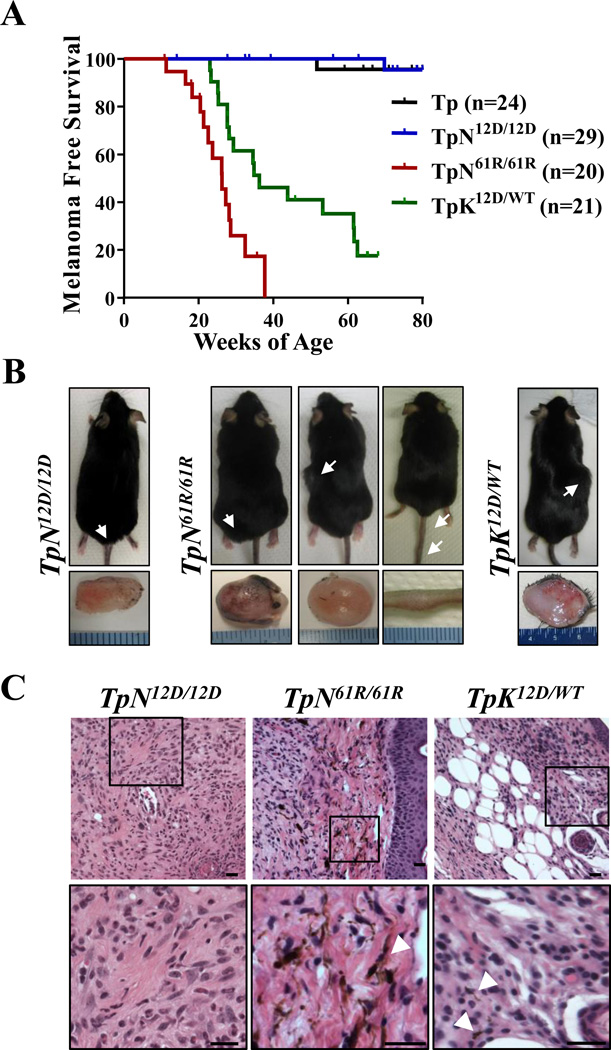
Figure 2. In vivo melanomagenesis is isoform and mutation-specific.
(A) Kaplan-Meier curve of melanoma-free survival. Animals were followed for a total of 80 weeks. Survival of each strain was compared pairwise to that of TpN61R/61R animals using a log-rank (Mantel-Cox) test. The following significant p-values were determined: Tp and TpN12D/12D - p<0.0001; TpK12D/WT- p<0.0027. (B) Representative images of the amelanotic tumors found throughout the skin of TpN12D/12D, TpN61R/61R and TpK12D/WT animals. White arrowheads indicate the tumor location. (C) Hematoxylin and eosin staining of representative tumors of the indicated genotypes. Black bars represent a length of 20µm. White arrowheads indicate areas of melanin deposition.

