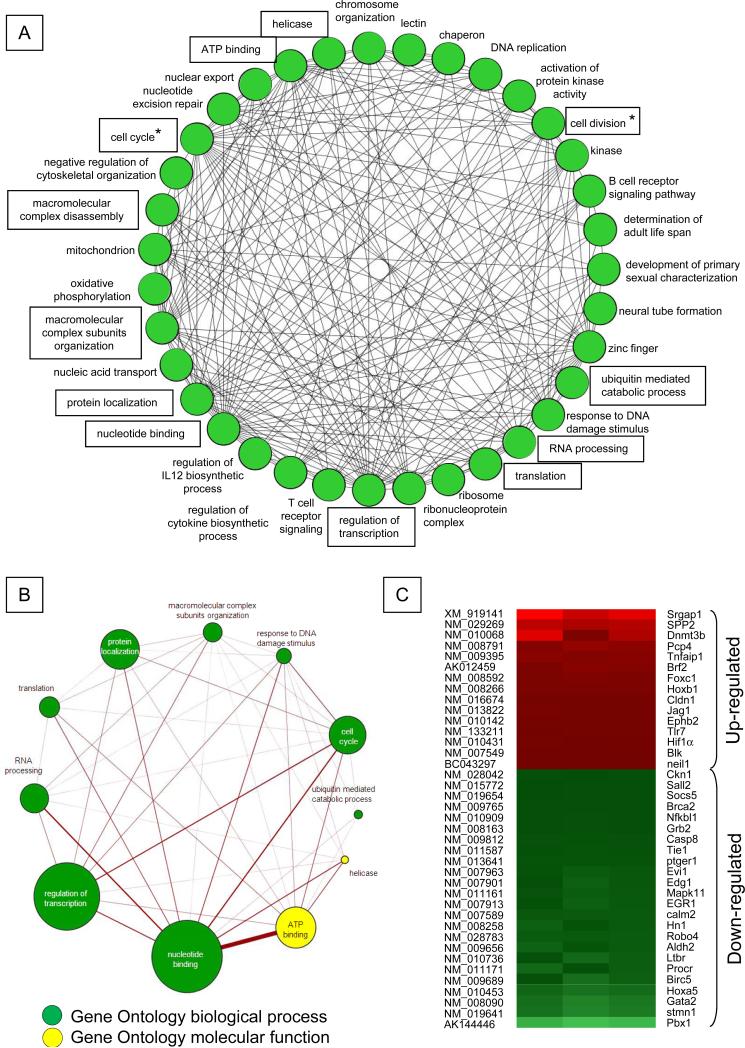
Figure 2. Functional gene networks regulated by Survivin in mouse CD34negKSL cells.
A. Genes significantly regulated by Survivin in three independent microarray analyses (P<0.05) were functionally classified according to the biological process and molecular function listed in the Gene Ontology database, and the analysis was performed using DAVID software (20) and visualized using the Cytoscape program (21). Genes for which annotations could not be assigned were excluded. A circle (node) indicates individual functions, and the line (edge) indicates the presence of shared genes between each functional group. Functional categories are boxed and also shown in Figure 2B. Asterisks indicate functions related to the cell cycle and cell division for which Survivin has been implicated.
B. The panel shows the 11 functional categories containing the greatest number of genes among the 35 groups. The size of each circle represents the number of genes involved in each functional category, and the thickness of the line indicates the number of genes shared between given functions. Green or yellow circles represent functions defined by biological process or molecular function, respectively.
C. Heat map for mouse HSC-specific genes (26) found to be differentially modulated by Survivin depletion in CD34negKSL cells.

