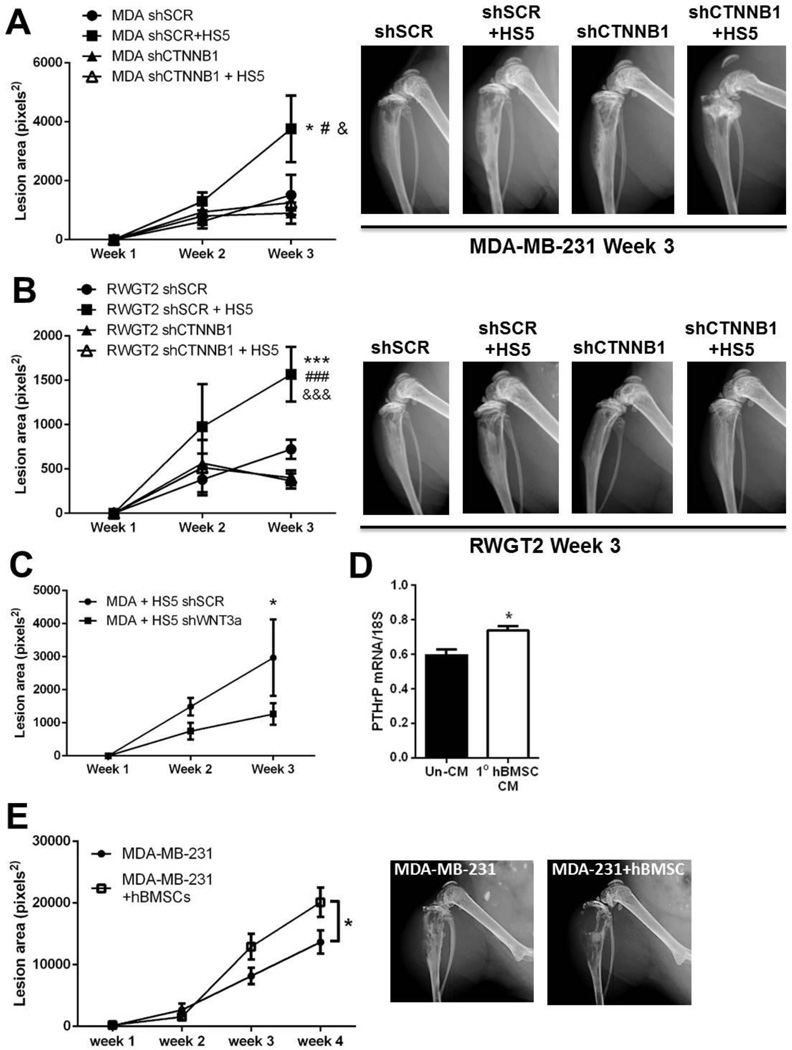
Figure 7. Stromal cell promotion of tumor-induced osteolysis is dependent on Wnt signaling.
(A) Osteolytic lesion area (average/group) at weeks 1–3 as determined by ROI analysis following intratibial inoculation of MDA-MB-231 scrambled control cells (shSCR) or MDA-MB-231 cells with β-catenin knockdown (shCTNNB1) alone or in combination with HS5 stromal cells. n=8/group. *p<0.05 vs MDA shSCR, #p<0.05 vs MDA shCTNNB1, &p<0.05 vs MDA shCTNNB1 + HS5 by 1-way ANOVA with Tukey Kramer analysis of means. (B) Osteolytic lesion area (average/group) at weeks 1–3 as determined by ROI analysis following intratibial inoculation of RWGT2 scrambled control cells (shSCR) or RWGT2 cells with β-catenin knockdown (shCTNNB1) alone or in combination with HS5 stromal cells. n=8/group. ***p<0.05 vs RWGT2 shSCR, ###p<0.05 vs RWGT2 shCTNNB1, &&&p<0.05 vs RWGT2 shCTNNB1 + HS5 by 1-way ANOVA with Tukey Kramer analysis of means. (C) Osteolytic lesion area (average/group) at weeks 1–3 as determined by ROI analysis following intratibial inoculation of MDA-MB-231 cells in combination with HS5 scrambled control (shSCR) stromal cells or HS5 cells with WNT3a knockdown (shWNT3a). n=8/group. *p<0.05 vs MDA + HS5 shWNT3a at week 3 by 1-way ANOVA with Sidak analysis of means. (D) PTHrP mRNA levels in MDA-MB-231 cells cultured in DMEM or conditioned media (CM) from primary human bone marrow stromal cells for 24 hours. n=3 replicates, and *p<0.05 by unpaired Student’s t-test. (E) Osteolytic lesion area (average/group) at weeks 1–4 as determined by ROI analysis following intratibial inoculation of MDA-MB-231 cells alone or in combination with primary human bone marrow stromal cells (hBMSCs). n=7–9 mice/group. *p<0.05 by 1-way ANOVA with Tukey Kramer analysis of means. For all graphs, data represent average/group + standard error of the mean.

