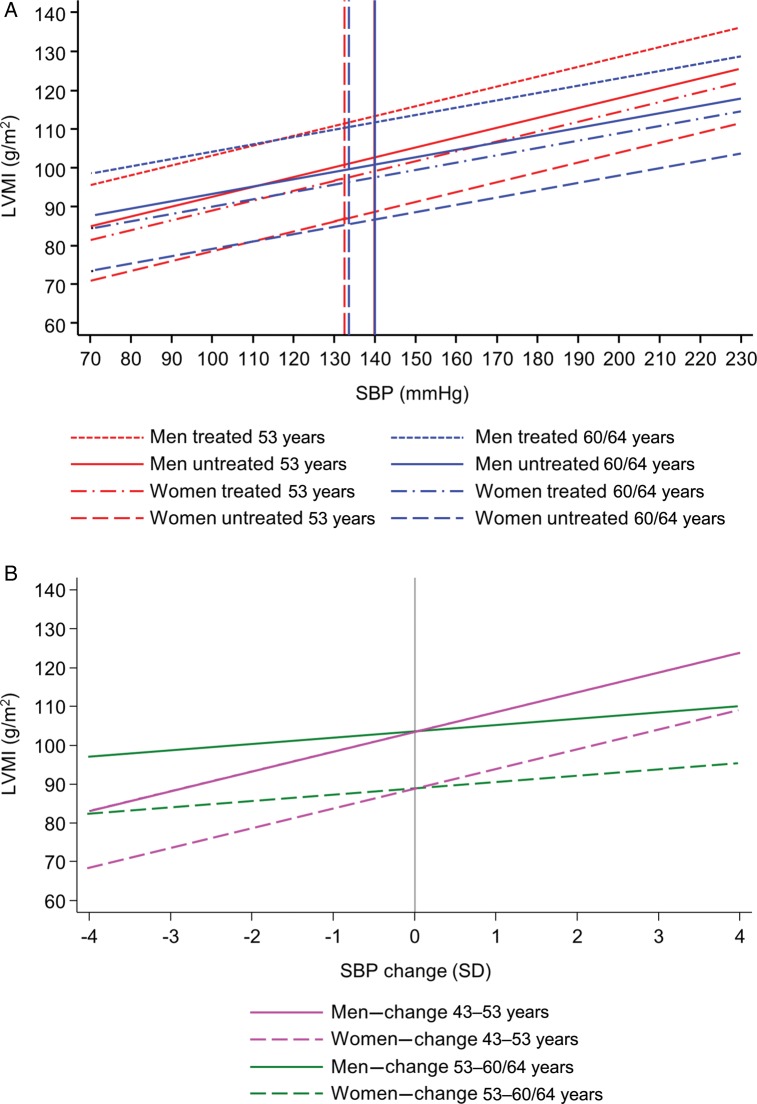
Figure 1.
(A) Predicted left ventricular mass index at 60–64 years by systolic blood pressure at 53 years (red) and by systolic blood pressure at 60–64 years (blue) plotted separately for men and women and by antihypertensive treatment status. Vertical lines represent mean systolic blood pressure in the National Survey of Health and Development sample; solid line for men and dashed line for women. (B) Predicted left ventricular mass index at 60–64 years by standard deviation change in systolic blood pressure between 43 and 53 years (magenta) and between 53 and 60–64 years (green) plotted separately for men (solid) and women (dashed), for individuals with an average conditional change in the other periods. Vertical lines represent mean systolic blood pressure change.

