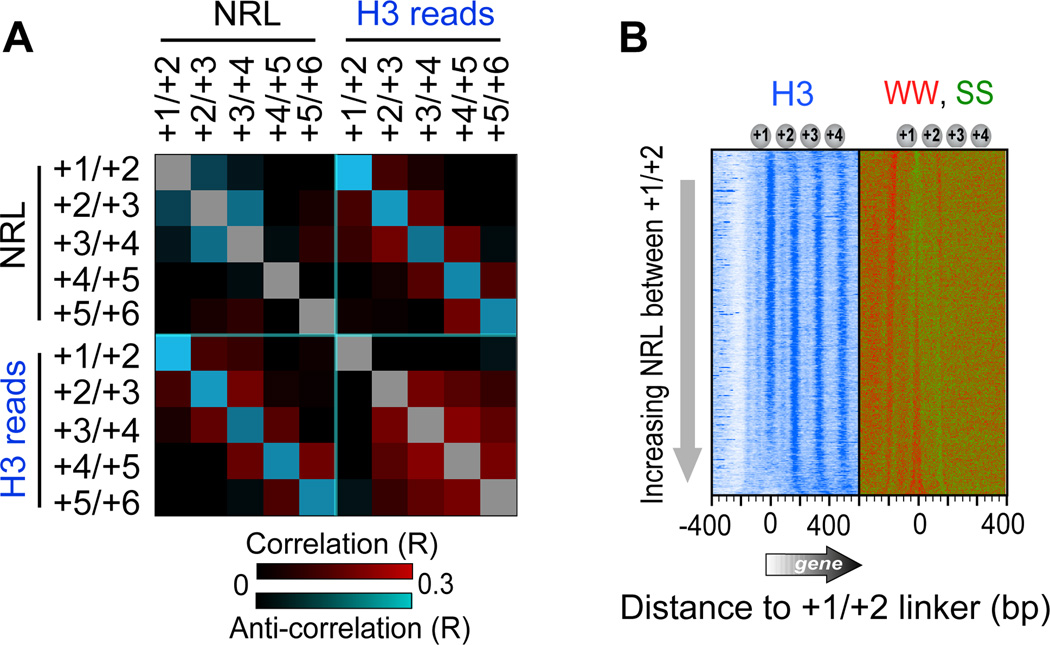
Figure 4. Sequence-based Localized Nucleosome Positioning.
(A) Heat map representing all pair-wise correlations (R) between NRLs and H3-linker occupancy levels at nucleosomes +1 through +6. Cyan and red represent negative and positive correlations, respectively. Calculations were based on nucleosomes at 3,194 genes longer than 1 kb (Table S2). NRL reports dyad-to-dyad distances in MNase-based maps (Zhang et al., 2011b). Similar observations were made with positions determined by ChlP-exo (not shown).
(B) Occupancy level of H3 ChlP-exo and SS/WW dinucleotide frequencies, relative to the midpoint between the +1 and +2 nucleosomes (Table S6), sorted by NRL between the +1 and +2 nucleosomes (Table S2).

