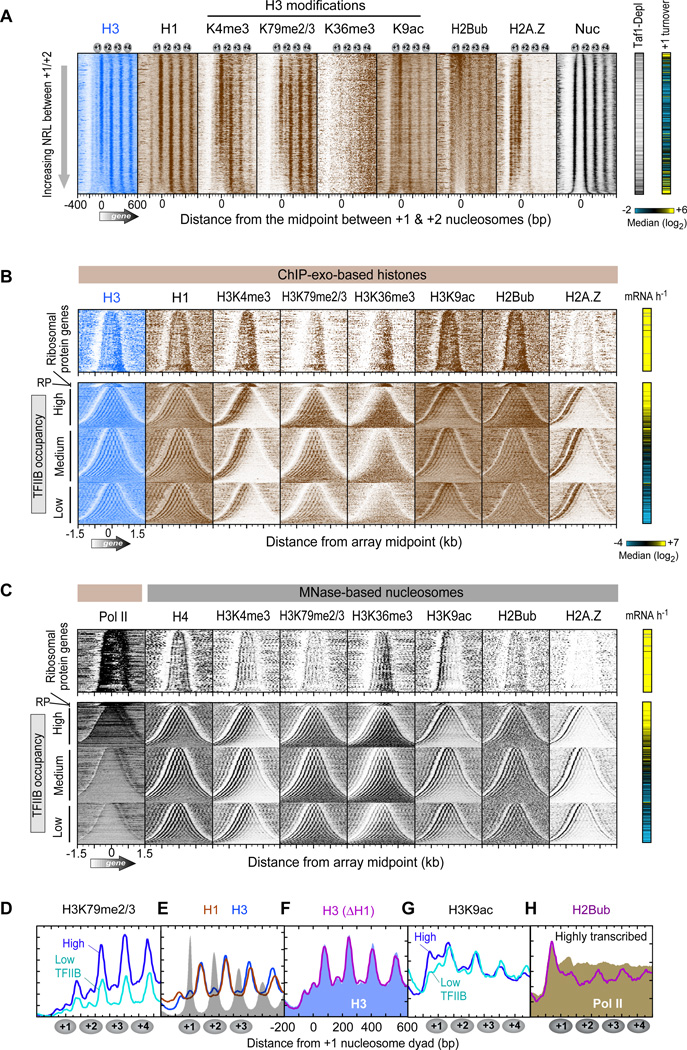
Figure 5. Subnucleosomal Organization of Histone Marks and Variants.
(A) Occupancy levels of histones and their marks relative to the +1/+2 linker, and sorted by linker length (n=4,738 genes; Table S7). The right panels demarcate Tafl-depleted genes (black lines) (Rhee and Pugh, 2012b) and histone turnover rate of the +1 nucleosome region (yellow indicates “hot” nucleosomes) (Dion et al., 2007).
(B) Same as panel A except that entire genic arrays are shown (5’ to 3’ from left to right). Arrays are sorted by array length and grouped by ribosomal protein (RP) genes (including an expanded vertical view), and the remaining by TFIIB occupancy (Rhee and Pugh, 2012b). The right panel shows transcription frequency (Holstege et al., 1998).
(C) Similar as panel B, except measured by MNase ChlP-seq from previous studies (Albert et al., 2007; Batta et al., 2011; Zhang et al., 2011a; Zhang et al., 2011b). Pol II denotes RNA polymerase II measured by ChlP-exo.
(D–H) Composite distribution of the indicated histones or marks relative to the +1 nucleosome midpoint at genes having TFIIB promoter occupancy in the top and bottom 30% (Rhee and Pugh, 2012b). E–F, are for all genes. F, H3 in a wild type strain is shown as a blue fill, and H3 in an hholΔ strain as a magenta trace. H, H2Bub (magenta) and Pol II (brown fill) are for genes having the top 30% of TFIIB occupancy.
See also Figure S4.

