Figure 1.

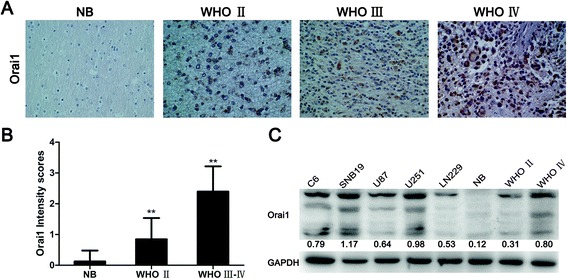
Expression of Orai1 in glioma samples and glioma cell lines. (A) Representative patterns of Orai1 expression in non-neoplastic brain tissues and glioma samples of different grades by immunohistochemistry. NB, non-neoplastic brain tissues. Magnification, ×200. (B) Intensity scores for STIM1 and Orai1 expression by immunohistochemistry. The data are shown as mean ± standard deviation (SD). **P < 0.01 (WHO II vs. NB, WHO III–IV vs. NB, and WHO III–IV vs. WHO II). (C) Western blot analysis of Orai1 expression in non-neoplastic brain tissues, glioma samples (WHO II and IV), and five typical glioma cell lines. The gray values represent the means of three independent experiments (normalized to GAPDH expression).
