
Figure 4.
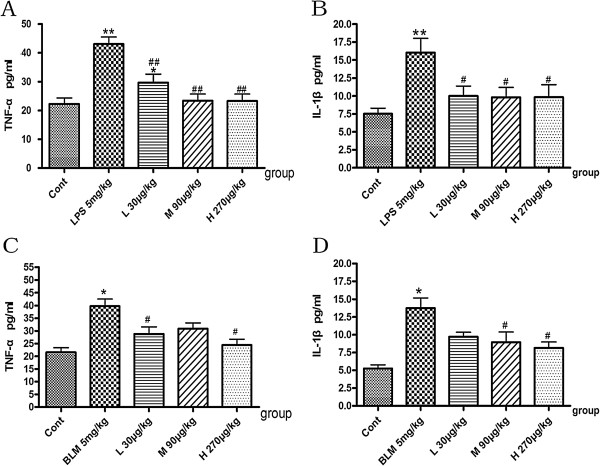
Effects of NNAV on serum levels of IL-1β and TNF-α. Animals were treated as described in the legend to Figure 1. The blood was collected from abdomen artery and serum IL-1β and TNF-α were measured with ELISA. (A) TNF-α in acute phase of LPS-treated. (B) IL-1β in acute phase of LPS-treated. (C) TNF-α of BLM-treated. (D) IL-1β of BLM-treated *P<0.05, BLM group compared to control group; #P<0.05, NNAV treated groups compared to BLM alone group. N =4 per group.