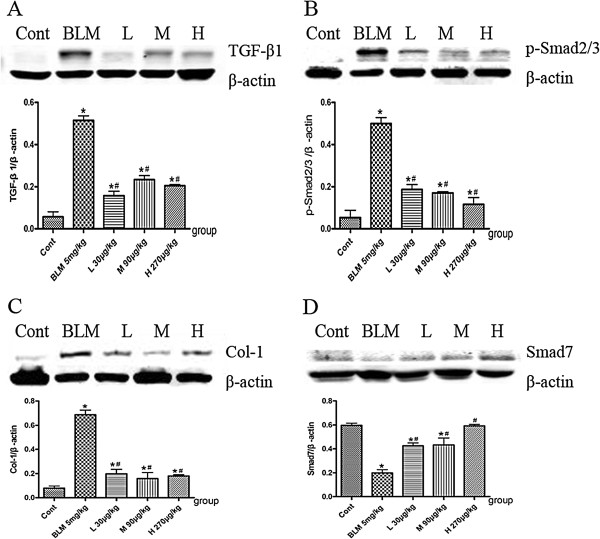
Figure 6.

Effects of NNAV on TGF-β/Smad pathway in the lung tissue. Animals were treated as described in the legend to Figure 1. All rats were killed 8 weeks after bleomycin exposure. The Lung was collected, homogenized and centrifuged, and then the supernatant was collected for Western blot analysis. (A) Protein expression of TGF-β1. (B) Protein expression of p-Smad2/3. (C) Protein expression of Collagen I. (D) Protein expression of Smad7. Bars represent the mean ± SD of a minimum of N=6 per group. *P<0.05, BLM group compared to control group, #P<0.05, NNAV-treated groups compared to BLM group.
