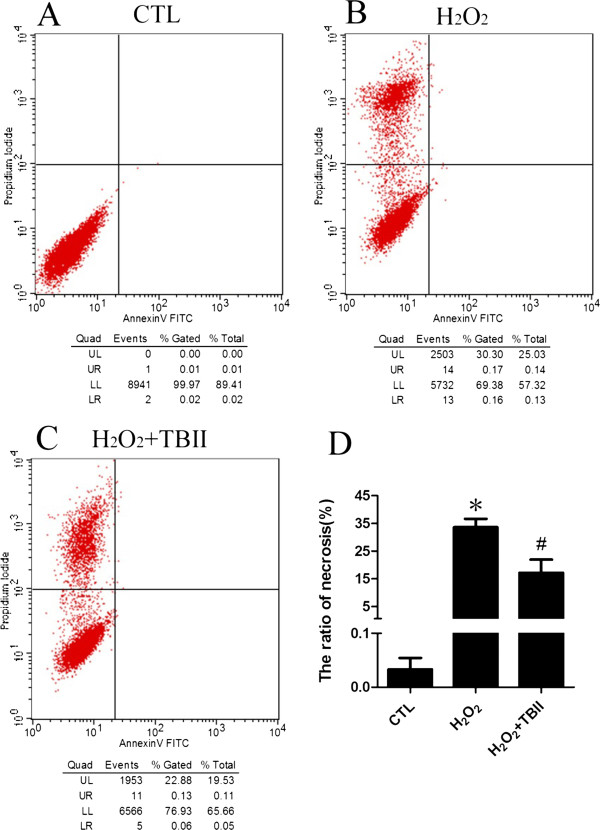
Figure 6.

The flow Cytometry analysis of RGC-5 cell line insult with H 2 O 2 after 12 hrs pretreating in different concentration of TBII. A: Normal Control; B: Model group (H2O2 treatment); C: TBII pretreatment group (H2O2 + 100 μM TBII); D: Statistical analysis; *vs CTL: p < 0.01; # vs Model group: p < 0.01.
