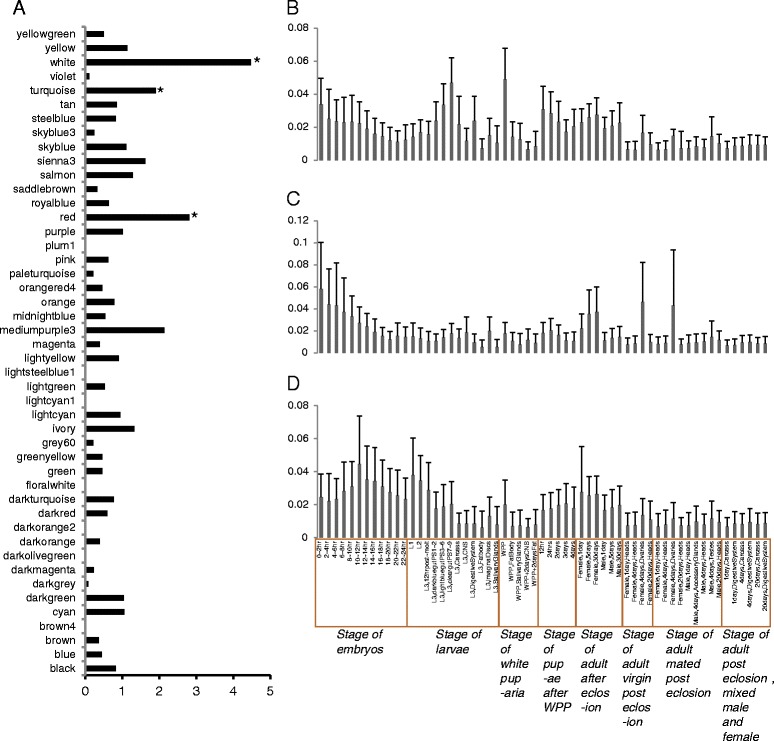
Figure 1.

Expression profile of completely lethal genes in each module. (A) Enrichment of completely lethal genes in gene modules. Stars identify modules with significant enrichment for lethal genes. (B-D) Histogram of the expression of genes in modules M17 (B), M6 (C) and M28 (D) and heatmaps of the expression of genes in this modules are seeing in Additional files 4 and 5. Expression of genes in each developmental stage was calculated as the expression in the stage divided by the sum of all stages. Mean expression and standard deviation (SD) of all genes in each stage are shown.
