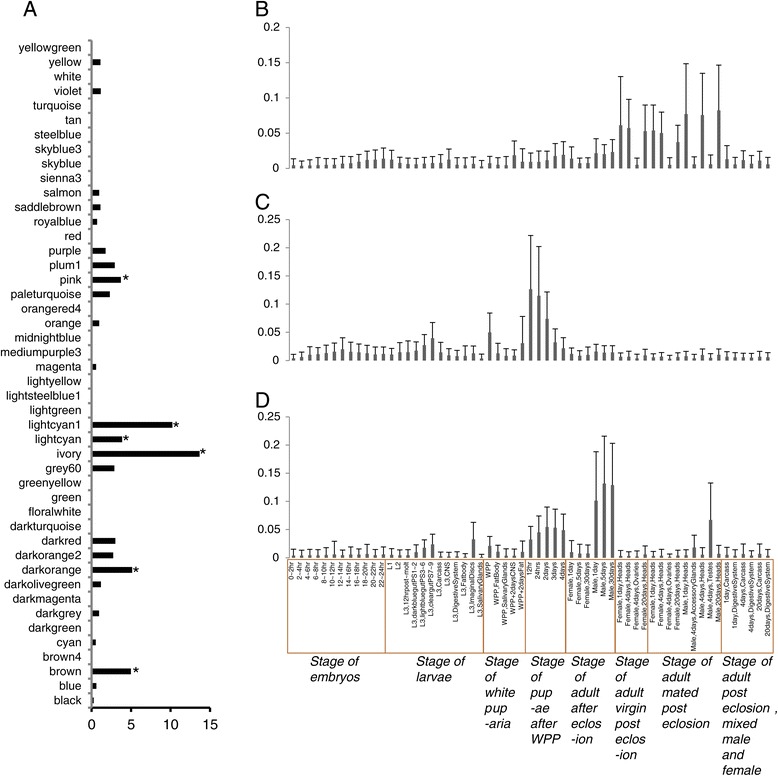
Figure 3.

Expression profile of lncRNAs in each module. (A) Enrichment of lncRNAs in each gene module. Stars show modules with significant enrichment in lncRNAs. (B-D) Histogram of the expression of genes in modules M46 (B), M20 (C) and M14 (D) and heatmaps of the expression of genes in this modules are seeing in Additional files 18, 19 and 20.
