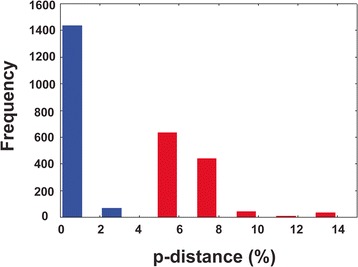
Figure 6.

Patterns of intra- and interspecific divergence in Echinostoma spp. using the nad 1 dataset. Red bars indicate intraspecific divergence; blue bars indicate iterspecific divergence (raw p-distances in %, pairwise comparisons between sister-species only).
