Figure 3.

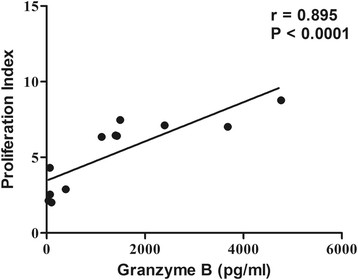
Comparative assessment of granzyme B level and proliferation index upon TSLA stimulation of PBMCs in HVL (n = 12) group. Correlation was calculated by Spearman rank correlation test. Diagonal line represents the best fit line.

Comparative assessment of granzyme B level and proliferation index upon TSLA stimulation of PBMCs in HVL (n = 12) group. Correlation was calculated by Spearman rank correlation test. Diagonal line represents the best fit line.