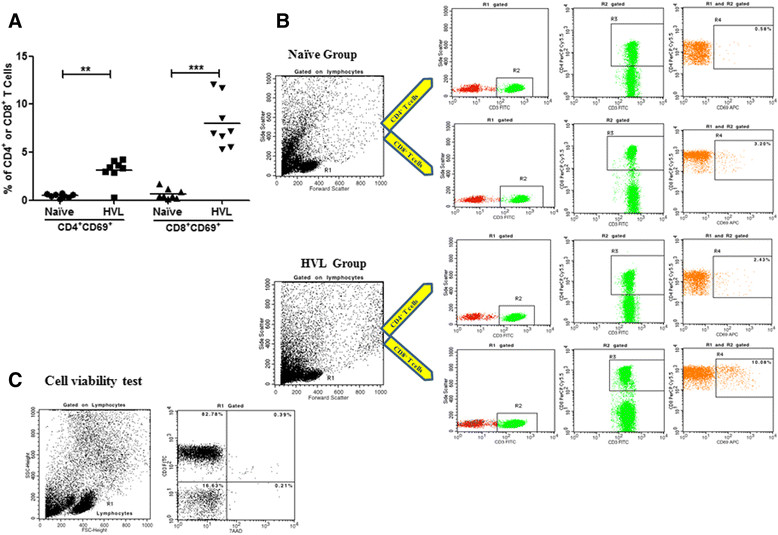
Figure 4.

Estimation of activated T lymphocytes. (A) Percentage of TSLA-activated CD4+ and CD8+ T cells in HVL and naive groups. PBMCs from HVL (n = 8) and naive (n = 8) were incubated with TSLA (10 μg/ml) for 120 hrs at 37°C. The values of unstimulated cells were substracted from TSLA stimulated cells. (B) Data showing representative FACS analysis in one each from HVL and naive individuals. Analysis gates were set for lymphocytes using forward and side scatter properties and the frequencies of activated CD4+ and CD8+cells were acquired on CD3+ T cells. (C) Cell viability test using 7AAD staining was done and the data show a representative FACS analysis in one of HVL individuals. Horizontal lines indicate mean values. *p < 0.05, **p < 0.01.
