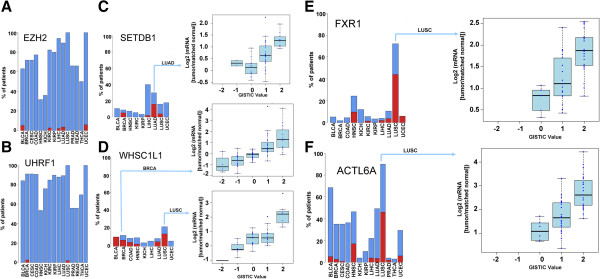
Figure 5.

Correlation between mRNA expression and copy number variation. (A-F) Recurrence of gene overexpression in tumor samples across different cancer types (blue bars - log2(mRNA(tumor/matched normal)) >1) compared with recurrence of gene amplification (red bars - GISTIC =2 and log2(mRNA(tumor/matched normal)) >1). (C-F) Box plots distribution of changes in gene expression levels (log2(mRNA(tumor/matched normal))) in tumor samples grouped by GISTIC values (that is, levels of copy number variation).
