Figure 4.

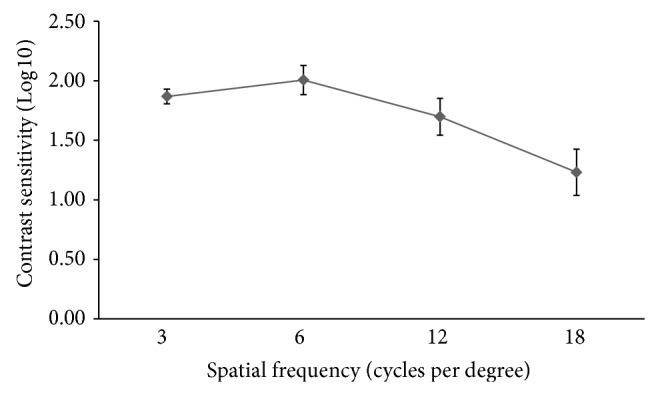
Monocular log contrast sensitivity at different spatial frequencies at 6 months. The error bar represents the 95% confidence interval of the mean.

Monocular log contrast sensitivity at different spatial frequencies at 6 months. The error bar represents the 95% confidence interval of the mean.