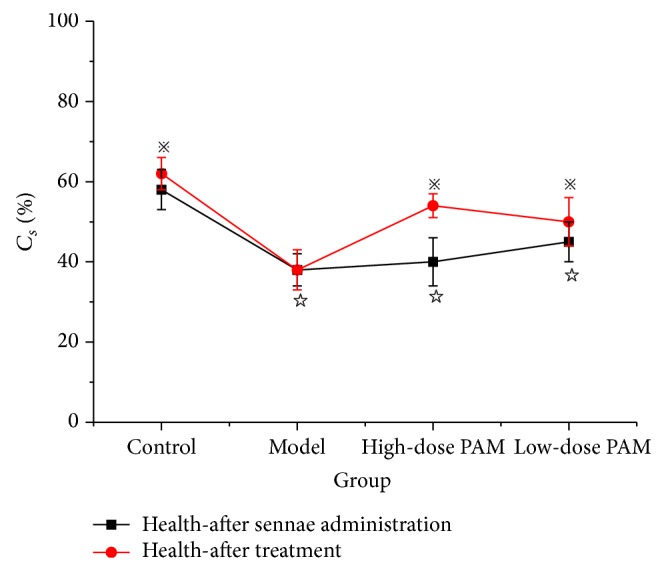
Figure 10.

Similarity coefficient index (C s%) of ERIC-PCR fingerprintings of rat intestinal flora before and after PAM treatment. Control: Group 1, received distilled water in both inducement and treatment phases. Model: Group 2, received senna administration but distilled water during treatment; High-dose PAM and Low-dose PAM: Group 3 and Group 4, received high and low doses of PAM repectively during treatment. (P ☆ < 0.05, compared with the control; P ※ < 0.05 compared with the model.)
