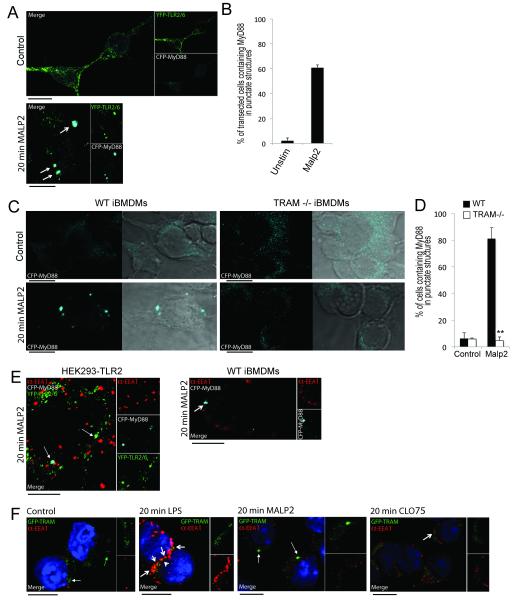
Figure 6. Endosomal localization of MyD88 after TLR2 stimulation is TRAM-dependent.
(A) Confocal image of YFP-TLR2 and YFP-TLR6 (green) in HEK293T cells coexpressing CFP-MyD88 (cyan). Cells were left untreated (top panel) or treated with 50 nM Malp2 for 20 min (bottom panel). The arrows indicate areas of overlap in the overlay panels. Data are representative of two independent experiments. (B) Transfected cells from (A) were observed by confocal microscopy and scored for CFP-MyD88-containing punctate structures. At least 100 cells were counted for each sample. Values shown are mean ± spread from the two independent experiments. (C) Confocal images of iBMDMs expressing CFP-MyD88. WT (left panels) or TRAM−/− (right panels) iBMDMs were left untreated (top panels) or treated with 50 nM Malp2 for 20 min (bottom panels). Data are representative of three independent experiments. (D) Transfected cells from (C) were observed by confocal microscopy and scored for CFP-MyD88-containing punctate structures. At least 100 cells were counted for each sample. Values shown are mean ± SD from the three independent experiments **p<005 compared to WT cells. (E) Confocal images of (left panel) YFP-TLR2 and YFP-TLR6 (green) in HEK293T cells co-expressing CFP-MyD88 (cyan) and stained for EEA1 (red), or (right panel) WT BMDMs expressing CFP-MyD88 (cyan) and stained for EEA1 (red). Cells were treated with 50 nM Malp2 for 20 min. Arrows indicate areas of overlap in the overlay panels between MyD88 and TLR2/6 (left panel) or MyD88 accumulation (right panel). Data are representative of three independent experiments. (F) Confocal images of GFP-TRAM (green) in WT iBMDMs co-stained for EEA1 (red). WT iBMDMs were left untreated (first panel) or treated with LPS (100ng/ml, second panel), Malp2 (50nM, third panel) or CLO75 (2.5 μg/ml, fourth panel) for 20 min. Closed arrows indicate regions of TRAM localized to EEA1 negative compartments; open arrows indicate overlapping TRAM and EEA1 regions which appear as yellow in the overlay panels. Data are representative of two independent experiments. All scale bars represent 10 μm.

