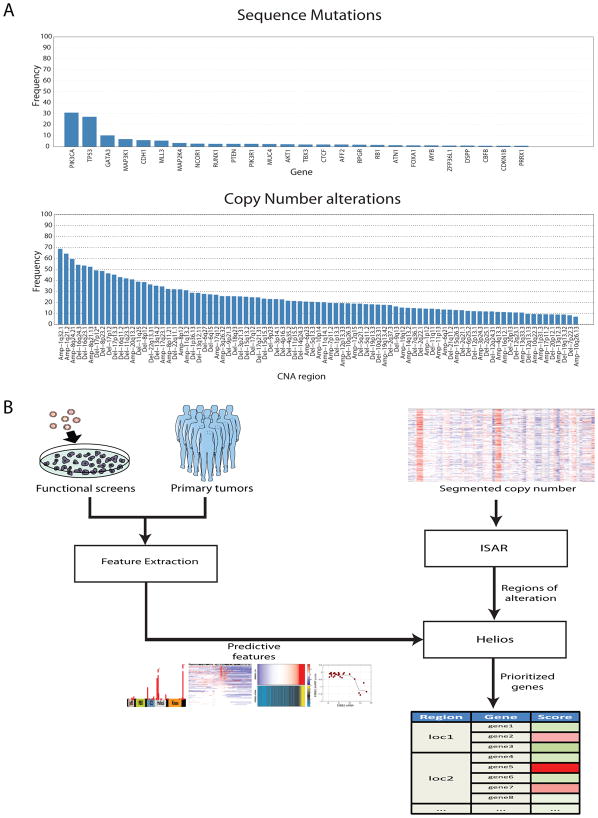
Figure 1. Helios integrates data from primary tumor and functional screens.
(A) Frequency of alteration in the TCGA breast cancer dataset of (top) genes with recurrent point mutations and (bottom) regions of recurrent copy number alteration. Significant genes and regions were downloaded from the DBroad Genome Data Analysis Center, selecting the TCGA pipeline algorithms GISTIC2 (v. 4.2012021700.0.0) and MutSig (v. 4.2011112800.0.0) (B) A schematic of our pipeline for the identification of candidate driver genes. The method first uses ISAR to identify regions of focal SCNAs. To pinpoint drivers within those regions, it extracts features from genetic, genomic and functional data, which are integrated into a single probabilistic score by Helios.

