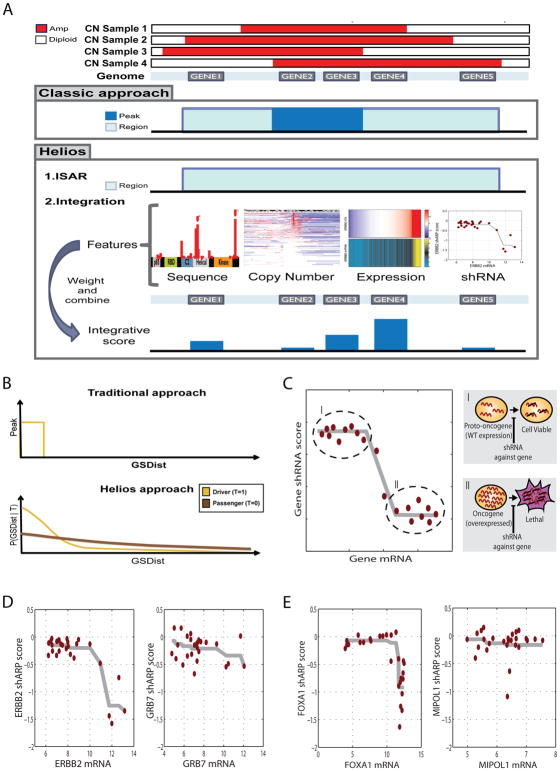
Figure 2. Helios features.
(A) Diagram of the classic and Helios approach. While the classic approach relies solely on copy number, both to identify significantly altered regions and to further narrow down those region to a minimal region of maximal alteration, Helios identifies regions in the same fashion, but then integrates features extracted from different data sources to compute the probability of each gene being a target of the region. (B) Diagram of the copy number model of the Helios Algorithm. The classic approach (top) calculate a hard threshold on the delta to the most altered marker (GSDist, X axis) to define the peak region (Y axis). Helios (bottom) instead calculates the probability (Y axis) of displaying a GSDist value (X axis) for both driver and passenger genes (yellow or brown curves respectively). (C) Our oncogene addiction score uses monotonic regression to measure the association between gene dosage (X axis) and shRNA dropout (Y axis), aiming to differentiate the proto-ongonenic state (I) of the driver, which is expressed at wild type levels, and the oncogenic state (II), which is characterized by high expression and high dependency on the gene for survival. (D) Monotonic regression of the shRNA dropout (Y axis) based on the gene dosage (X axis) for the two top scoring genes for oncogene addiction in the 17q12 region. (E) Monotonic regression of the shRNA dropout (Y axis) based on the gene dosage (X axis) for the two top scoring genes for oncogene addiction in the 14q13 region.

