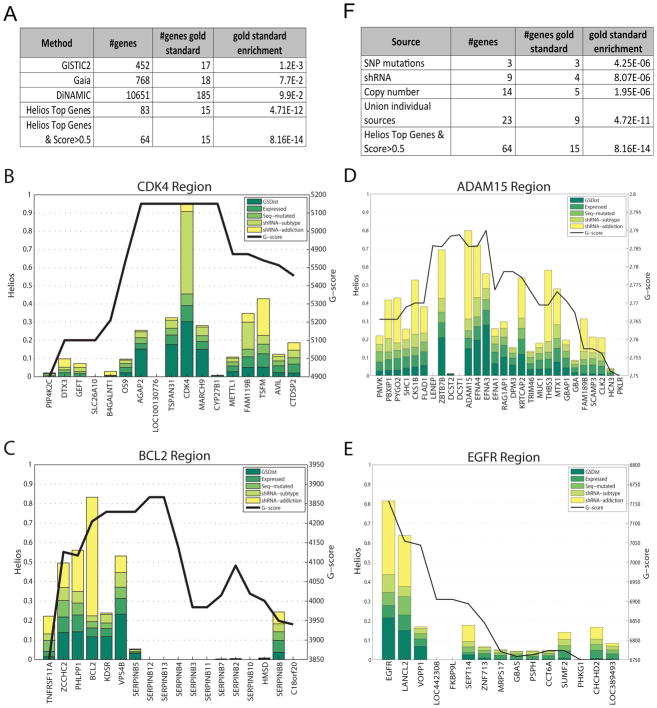
Figure 3. Helios analysis of Breast Cancer.
(A) A comparison of enrichment for a literature- compiled set of breast cancer drivers between our Helios genes defined as the top gene in each region with a score greater than 0.5) and three state of the art methods. (B),(C),(D) and (E) display the result of the Helios analysis for the 12p14, 18q21, 1q21 and 7p12 regions respectively. Genes in the ISAR regions are displayed in the X axis and the Helios score is represented by bars colored proportionally to the contribution of each feature (a logistic regression approximation is employed to approximate the contribution of each feature). The ISAR score is displayed as a black line. (F) A comparison between Helios and the results from the analysis of the data sources individually, testing for enrichment based on our literature compiled set of breast cancer drivers. See Supplementary Figure 3A–D for information about convergence and stability of the results.

