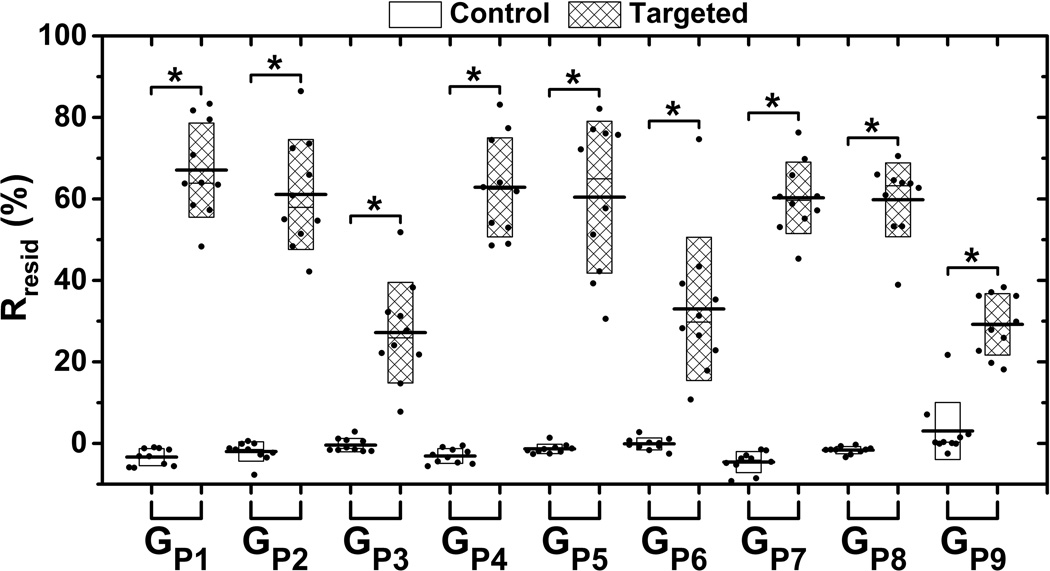
Figure 4.
The Rresid parameter across the different acoustic conditions listed in Table 1. Boxes (empty for control and filled for targeted phantom channels) show the range of [mean ± standard deviation]. Black lines located at the center of the boxes show the corresponding mean value from 10 trials. Raw data from 10 trials are shown as solid dots overlaid with corresponding boxes. For Student’s t-test, *: p < 0.001, n = 10.

