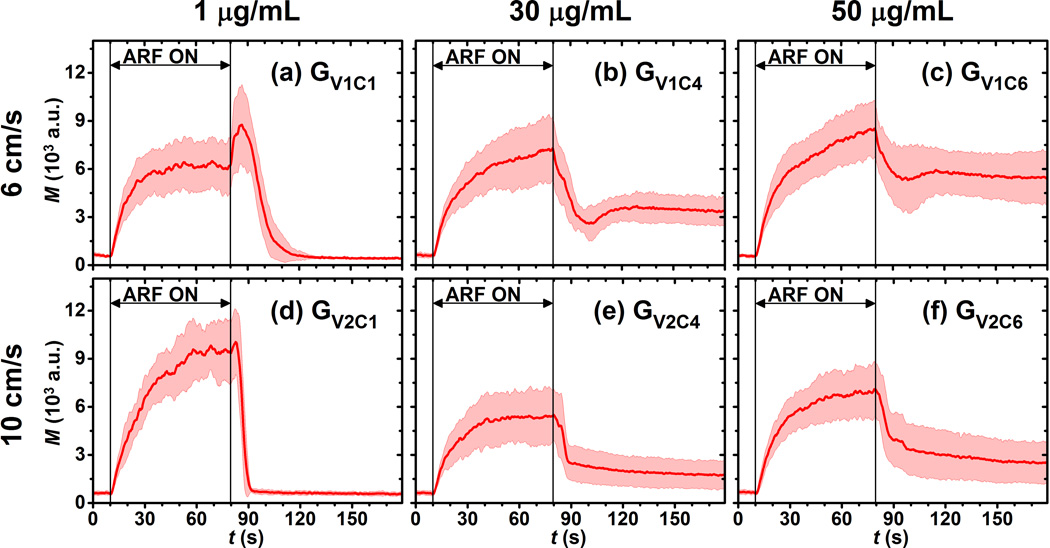
Figure 7.
Signal magnitude curves of adherent microbubbles in targeted phantom channels at different flow and incubation conditions listed in Table 3. (a) GV1C1, (b) GV1C4, (c) GV1C6, (d) GV2C1, (e) GV2C4, (f) GV2C6. Red solid lines indicate the mean values from 10 trials. Light color shadows indicate the corresponding error bars at the range of [mean ± standard deviation].

