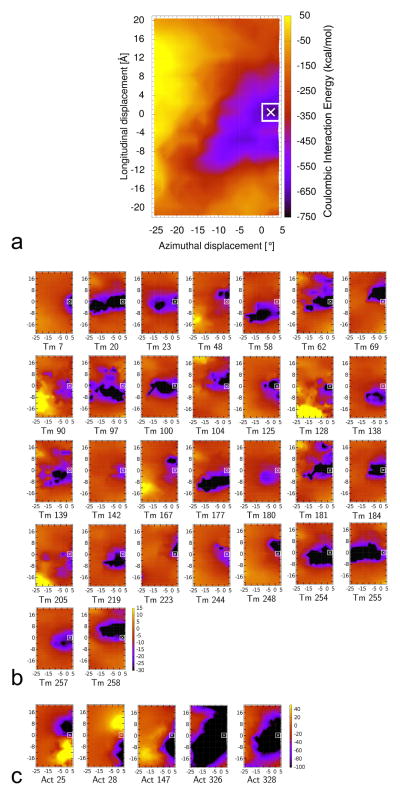
Figure 2.
Energy landscapes showing contributions of individual tropomyosin and actin residues to the collective electrostatic interaction of the two proteins on thin filaments, with the energy levels (in kcal/mol) shown by color scales. For each point measured, tropomyosin was repositioned longitudinally and azimuthally over actin (see Materials and Methods) and the respective Coulombic energy determined. The [0, 0] position corresponds to the minimum energy position occupied by full-length tropomyosin on F-actin as described by Li et al. [10] and the point indicated by the x marks a minor adjustment in the location of this position based on a refinement by Orzechowski et al. [11]. The energy landscape for the entire tropomyosin molecule moved over actin is shown in (a) (i.e. accounting for the combined energies of all interacting residues), and then this landscape was decomposed to show contributions derived from single tropomyosin (b) and single actin (c) residues, here showing landscapes only for those tropomyosin and actin residues that individually contribute to strong (> 10 kcal/mol) Coulombic interactions (residues numbered), whereas, in Figures S1 and S2, landscapes for all residues, regardless of interaction strength are shown. Note that the color scales differ in (a), (b) and (c).

