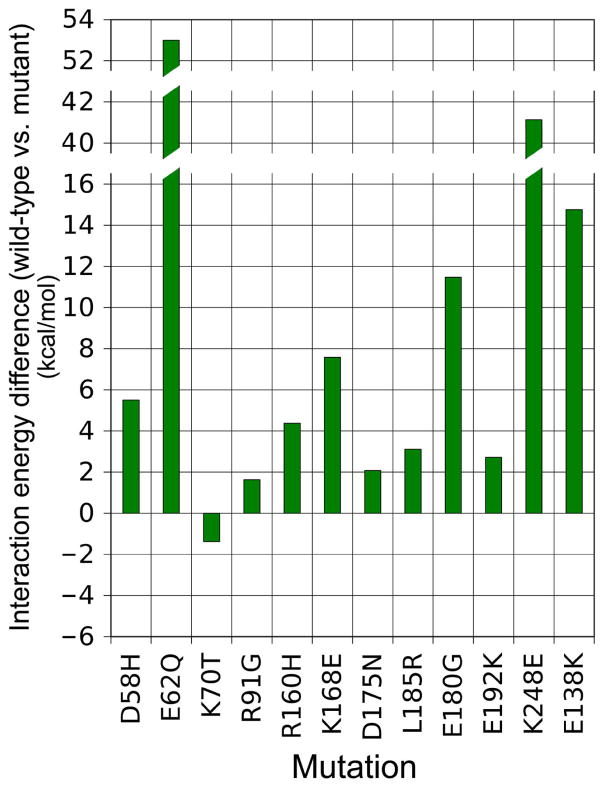
Figure 4.
Histograms revealing changes in Coulombic binding interactions between tropomyosin and actin due to tropomyosin mutations associated with hyper-contractility. Differences in electrostatic binding interaction surrounding the energy minimum site (averaged over an approximately 16 Å2 region as indicated by white squares in Figure 2) between wild-type and mutant tropomyosin landscapes quantified by subtracting one from the other. The positive values noted indicate a decrease in strength of binding by the mutants.

