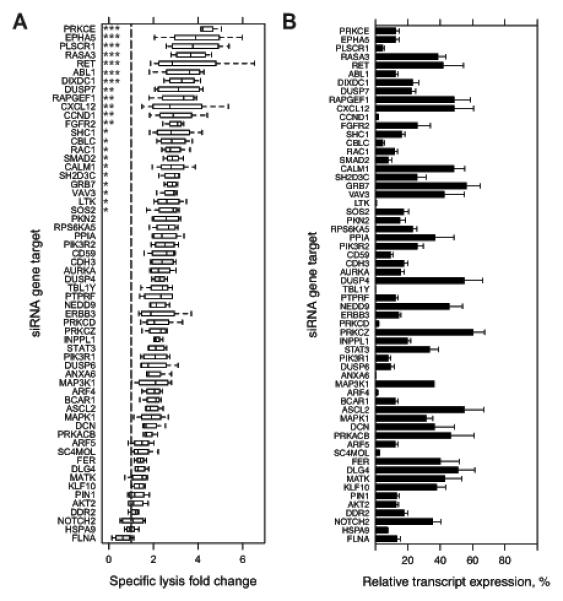
Figure 2.

Primary siRNA screen targeting A431 cells for genes whose knockdown enhances ADCC. A, Two primary screens were conducted in which an arrayed library of two pooled siRNA at 10 nM each per 60 targeted genes were reverse transfected in A431 cells in 96-well plates. At 48 h post-transfection, three treatments were added: 1 μg/mL cetuximab alone; 20,000 NK92-CD16V cells alone; and the combination of cetuximab and NK92-CD16V cells. All transfections and treatments were conducted in duplicate for each primary screen. Specific lysis of the combined cetuximab and NK92-CD16V cell treatments was calculated for each replicate siRNA gene target. Specific lysis fold-change relative to a negative control siRNA (dashed vertical line, normalized to 1) was calculated for each replicate in each screen. Specific lysis fold-change values are represented as boxplots of two independent measurements in two primary screens (n=4). Statistical significance was assessed by ANOVA followed by Dunnett’s multiple comparison test correction for each siRNA gene target versus the negative control siRNA. *, p<0.05; **, p<0.01; and ***, p<0.001. B, A431 cells were reverse transfected as described in A, RNA isolated 48 h later, cDNA generated, and real-time quantitative reverse-transcription PCR (q-RT-PCR) was conducted to assess knockdown of each targeted genes. Percent relative expression was calculated compared to the negative control siRNA transfection and calibrated by GAPDH expression. Percent relative expression for each siRNA target genes are ordered as in A. *, p<0.05; and **, p<0.01. Error bars represent s.d. of the mean from three independent experiments (n=3).
