Figure 3.

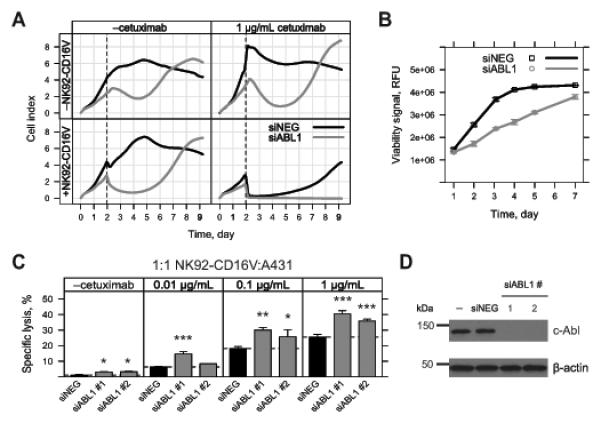
Characterizing the effect of ABL1 knockdown on proliferation, viability, and sensitivity to ADCC in A431 cells. A, A431 cells were reverse transfected with 10 nM ABL1 (siABL1, gray) or negative control siRNA (siNEG, black) in a 96-well real-time cell assay (RTCA) plate. Cell index was measured by RTCA every 10 min over the entire time course of the experiment (9 days). Cell index was derived from the impedance of adhered cells in the individual wells of the RTCA plate. Following reverse transfection, treatments were added at 48 h (dashed line) as follows: top left, vehicle (media); top right, 1 μg/mL cetuximab; bottom left, 20,000 NK92-CD16V effector cells; bottom right, 1 μg/mL cetuximab and 20,000 NK92-CD16V effector cells. Each cell index line represents the mean of three independent assessments (n=3) from one representative of three experiments. B, A431 cells were reverse transfected 10 nM ABL1 siRNA (siABL1, gray) or negative control siRNA (siNEG, black) in 96-well format. Fluorometric viability assays were conducted at the indicated time points. Each viability measurement represents the mean of three independent measurements (n=3) from one representative of four experiments. C, A431 cells were reverse transfected in six-well plates with 10 nM ABL1 siRNA (siABL1 #1 or #2, gray bars) or negative control siRNA (siNEG, black bars). siABL1 #1 is the same ABL1 siRNA used in A. Reverse transfected cells were collected at 48 h and re-plated at 20,000 viable cells/well in a 96-well plate. Following a brief incubation, the following treatments were added: vehicle (media); cetuximab (0.01, 0.1 and 1 μg/mL); 20,000 NK92-CD16V cells; and 20,000 NK92-CD16V cells and cetuximab (0.01, 0.1 and 1 μg/mL). Cytotoxicity was assessed 4 h later and specific lysis by NK92-CD16V cells was determined in the absence or presence of cetuximab. Each ABL1 siRNA was compared to the negative control siRNA within each sub-panel. *, p<0.05; **, p<0.01; and ***, p<0.001 from two-tailed t-tests. Results are from three independent experiments (n=3). D, A431 cells were reverse transfected without siRNA (–) or with 10 nM negative control (siNEG) or ABL1 siRNA (siABL1 #1 or #2 as used in C). Cell lysates were collected, applied to SDS-PAGE, and transferred to a membrane, and blotted for c-Abl. c-Abl expression was undetectable for the two ABL1 siRNAs transfections, although faint bands were visible upon overexposure (data not shown). The same membrane was blotted for β-actin as a loading control. Results are representative of two experiments. For panels B and C, error bars represent s.d. of the mean.
