Fig. 3.
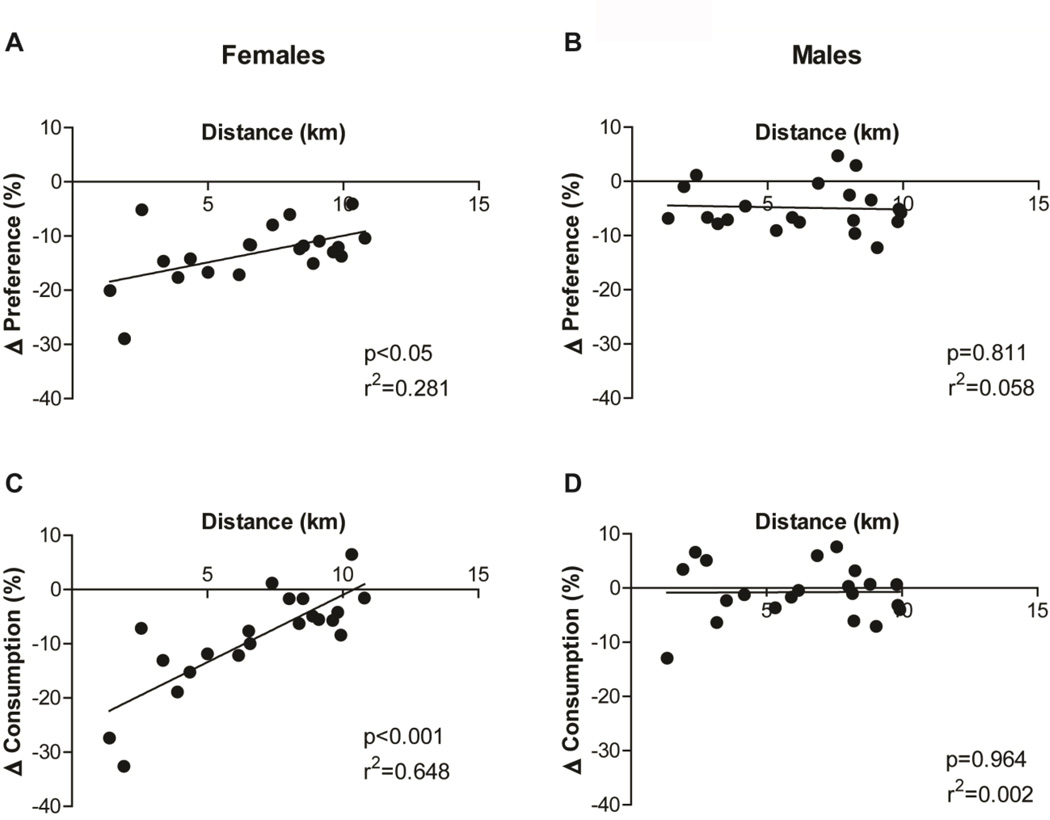
The distance travelled in female mice is determinant to its effects on ethanol preference and consumption. Graphs show the correlation between the amount of distance travelled and the difference (Δ= “Exercised-Ethanol”-“Sedentary-Ethanol”) in (A, B) ethanol preference and (C, D) consumption of (A, C) female and (B, D) male mice. Linear regression p-value and r-square are shown on the right bottom of each graph.

