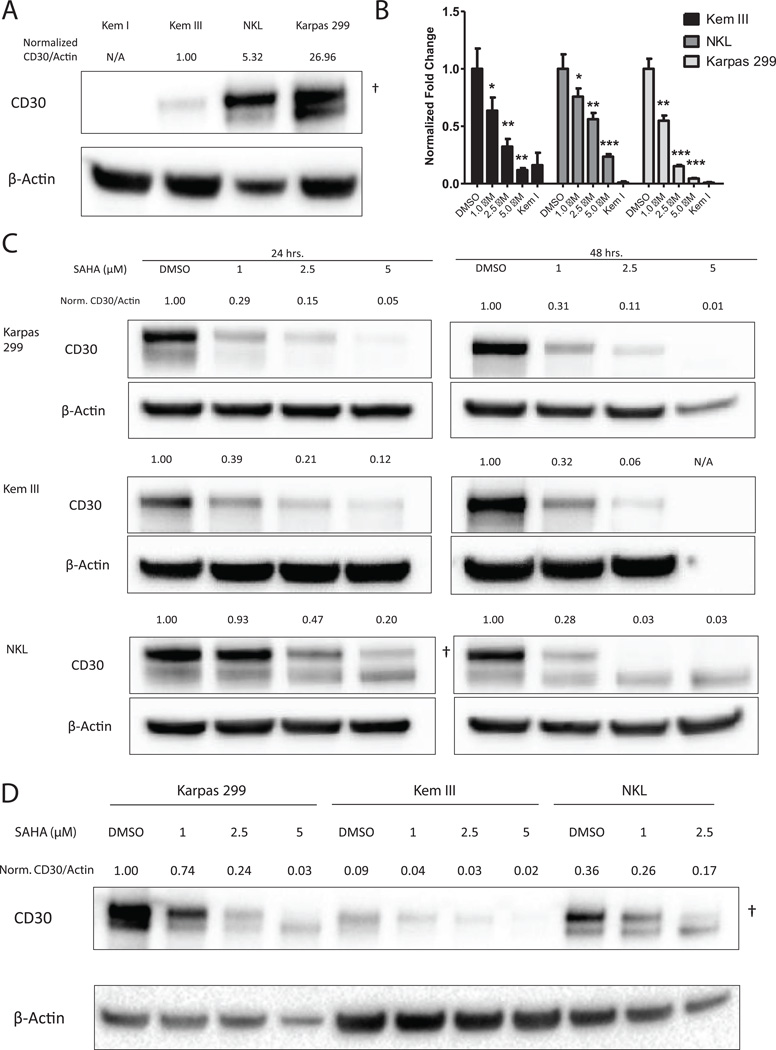
Figure 1. SAHA downregulates CD30 mRNA and protein.
(A) Kem III, NKL and Karpas 299 cells were assayed for basal CD30 expression by immunoblot. Kem I served as a negative control. Actin served as a loading control. Kem III, NKL and Karpas 299 cells were treated with SAHA (1 µM, 2.5 µM and 5 µM) or DMSO for 24 or 48 hours. (B) Cells were assayed for CD30 mRNA expression 24 hours post treatment by qPCR using the ΔΔCt method.. Each cell line is normalized to its DMSO control. *p<0.05, **p<0.005, ***p<0.0005 vs. vehicle control as determined by t-test. (C,D) Protein levels were also measured after treatment with SAHA, and CD30 to actin ratios normalized to (A) Kem I or (D) DMSO control are indicated above the figure. Quantification was limited to membrane bound CD30 (†) and does not include unprocessed cytoplasmic protein (lower band) (25).

