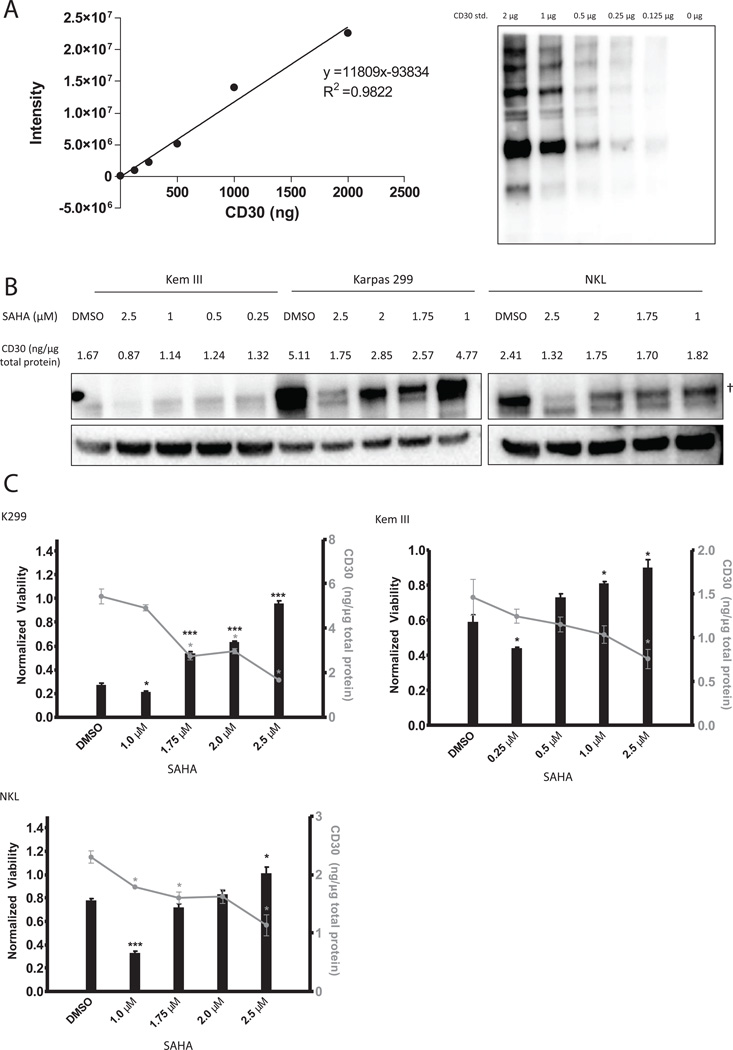
Figure 4. SAHA decreases the efficacy of brentuximab vedotin when CD30 levels decrease to 50–60%.
(A) Purified CD30 peptide (serial dilutions between 2-0 µg/lane) was run and quantified by immunoblotting to generate a standard curve. (B) Karpas 299, Kem III and NKL cells were treated for 24 hours with differing doses of SAHA or DMSO, and CD30 protein levels were quantified using a standard curve. The amount of CD30 (ng/µg of total cellular protein) is shown above each lane. Upper band represents membrane bound CD30 (†). The lower band is unprocessed cytoplasmic protein(25) and was excluded from analysis. (C) Following exposure to SAHA, cells were treated with 1 nM brentuximab vedotin for 72 hours and viability was assessed by MTS assay (indicated by vertical bars). The absolute amount CD30 protein per µg of total cellular protein, an average of two separate quantifications, is plotted above each viability data point (indicated by line graph).

