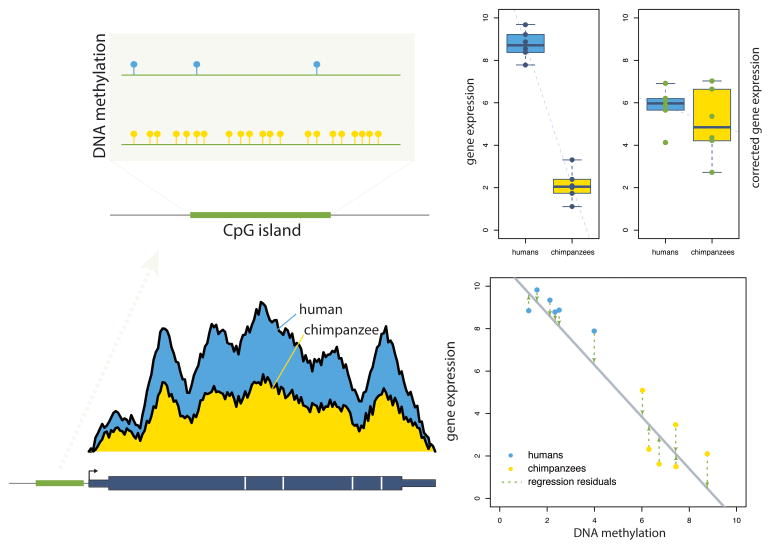
Figure 2. An approach for joint quantitative analysis of gene expression and regulatory data.
A major goal in comparative studies of regulatory mechanisms is to understand the extent to which quantitative differences in regulatory marks underlie differential gene expression levels. One approach to computationally test this is to perform a joint analysis of the extent to which genes are differentially expressed after controlling for a regulatory mark. This example shows a gene that is both differentially methylated in an upstream CpG island (top left) and differentially expressed between human and chimpanzee individuals (bottom left and right panel, left boxplot – where each point represents one individual; human and chimpanzee data is represented in blue and yellow respectively). To quantitatively test the extent to which this correlation might underlie the differential expression, it is possible to either (1) perform a differential expression analysis on the residual gene expression levels after regressing out the DNA methylation levels (represented in the bottom right) or (2) include the DNA methylation levels as an explanatory variable in the differential expression analysis. In this example, regressing out methylation levels results in significantly reduced evidence for differential expression between human and chimpanzee (right panel, right boxplot), supporting the possibility that DNA methylation differences might be underlying the differential gene expression. Note that these approaches rely heavily on established directions of causality between gene regulatory processes from previously published literature.

