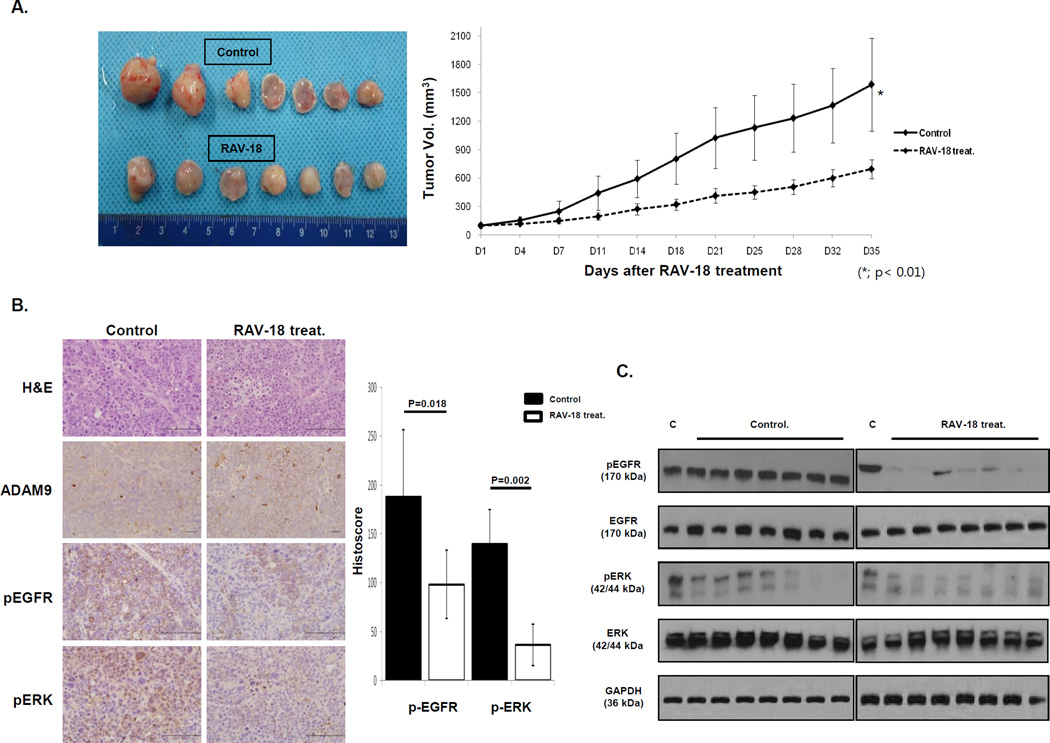
Figure 6. In vivo xenograft model of ADAM9.
(A) Photographs of tumors from control and RAV-18 treated groups. Tumor volumes increased in both control and RAV-18 treated groups, however, the tumor volumes of the control group were larger than in the RAV-18 treated group (p < 0.01). (B) Representative phospho-EGFR and phospho-ERK immunostaining (original images were captured at 400× magnification) and H&E staining. Average of phospho-EGFR histoscores in the control group was approximately two times higher than in the RAV-18 treated group (p = 0.018). Furthermore, the average phospho-ERK histoscores in controls was approximately three times higher than in RAV-18 treated groups (p = 0.002). (C) Western blot analysis showed that phospho-EGFR and phospho-ERK expressions were lower in the RAV-18 treated group. C: MKN-28 cell whole lysate.

