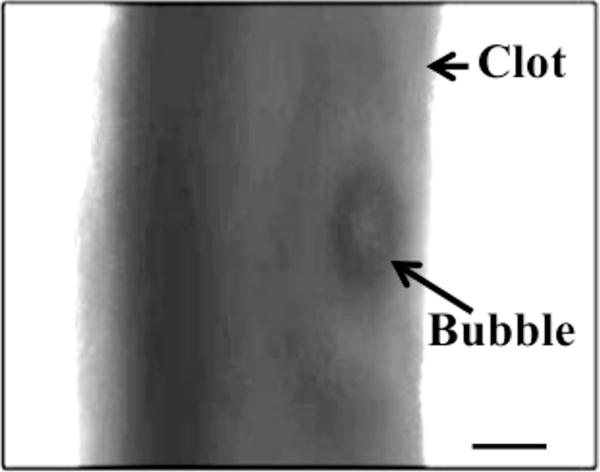
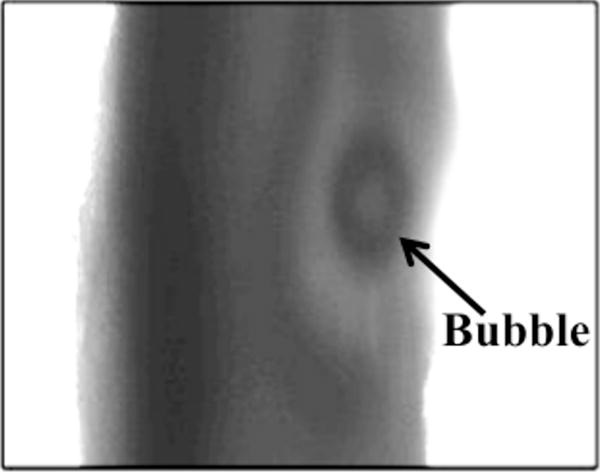
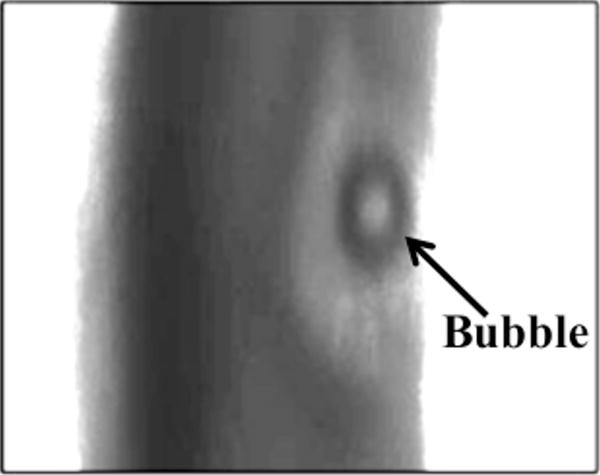
Figure 4.


Increase in pixel intensity surrounding stable oscillations of acoustically activated bubble. Lysis occurs over a long time scale compared to the acoustic period (interframe time is 1.7 s, acoustic period is 8.33 μs). The effluent surrounding the clot is human fresh-frozen plasma, recombinant tissue-type plasminogen activator (1.58 μg/mL), and Definity® (2 μL/mL). The ultrasound (120 kHz, 0.44 MPa continuous wave) is on during panels a–c. The bubble appears distorted due to the long exposure time of the camera (16 ms) compared to the acoustic period (8.33 μs).
