
Figure 5.
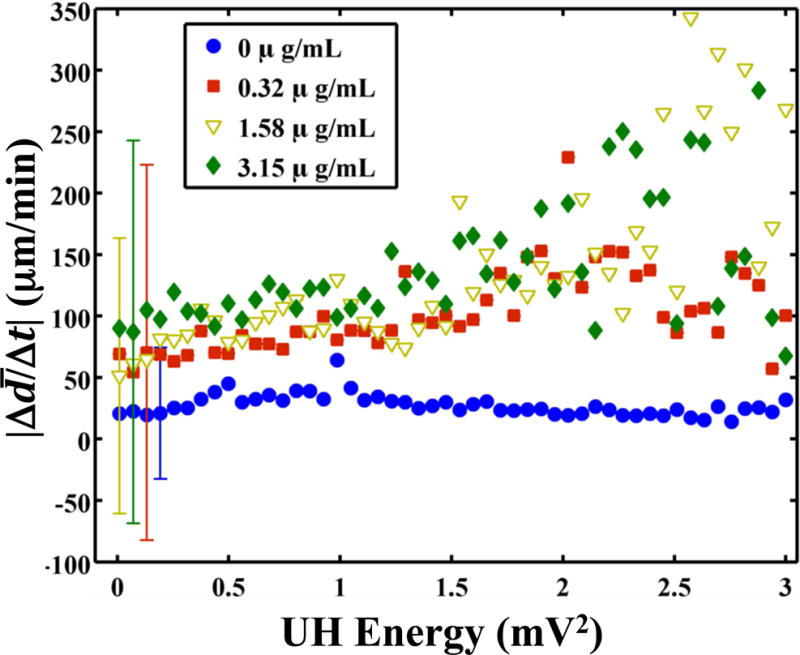
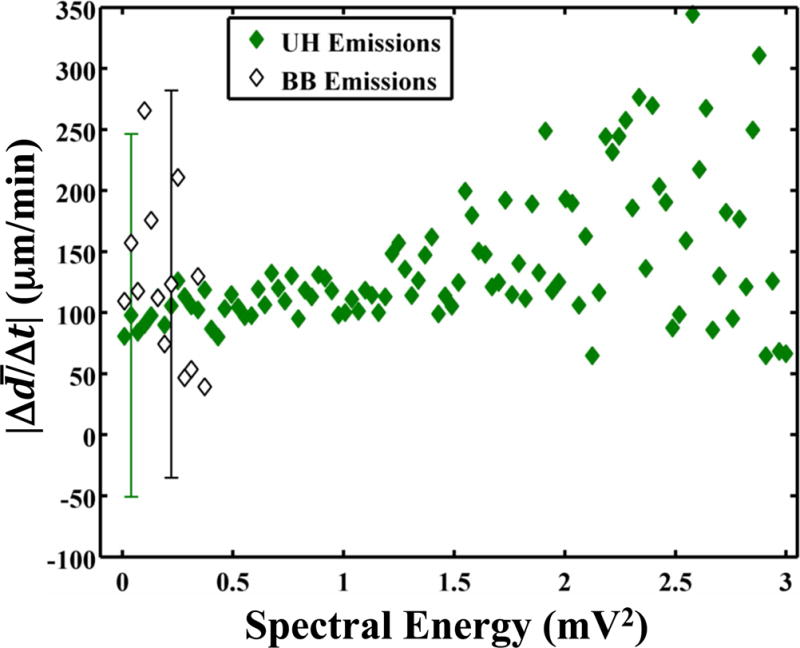
(a) The absolute lytic rate ( ) as a function of the UH energy at each concentration of recombinant tissue-type plasminogen activator (rt-PA). The lytic rate was computed using Equation (1), with t2 − t1 = 0.43 s, the interframe time of the clot images. The error bars are representative of the standard deviation of the lytic rate over a 0.05 mV2 range of UH energies. The lytic rate significantly correlates (p < 0.05) with the UH energy when rt-PA is present. (b) The absolute lytic rate ( ) as a function of ultraharmonic (UH) and broadband (BB) energy at an rt-PA concentration of 3.15 μg/mL. The lytic rate was computed using Equation (1), with t2 − t1 = 0.43 s, the interframe time of the clot images. The error bars are representative of the standard deviation of the lytic rate over a 0.03 mV2 range of UH energies.