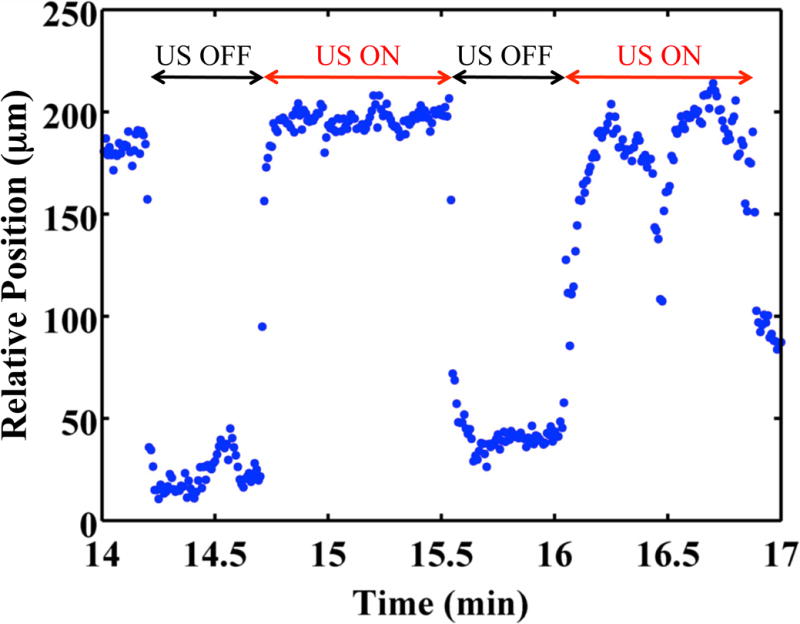
Figure 6.

Clot position as function of time. The clot position was 0 μm at time 0 min. The clot was exposed to 0.32 μg/mL recombinant tissue-type plasminogen activator, submegahertz - frequency ultrasound, and 2 μL/mL Definity®. Positive position values indicate movement along the direction of propagation of the ultrasound (i.e. away from the transducer).
