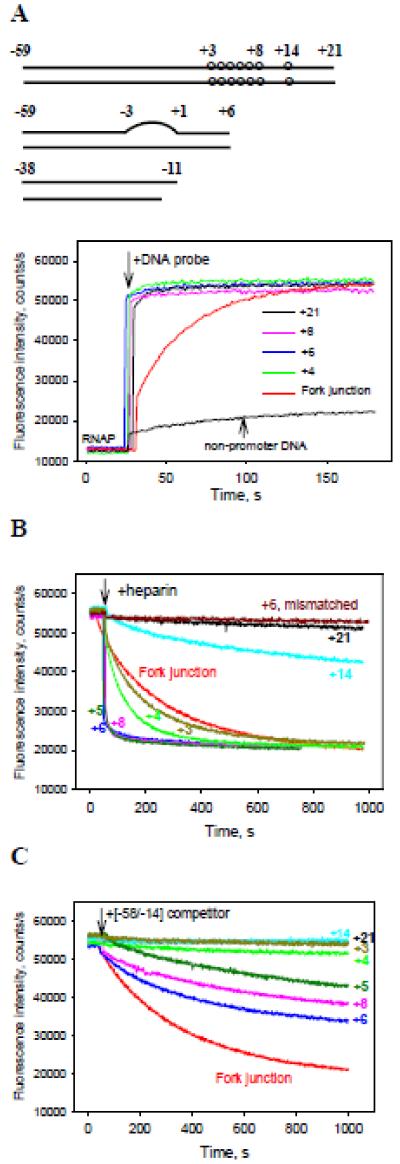
Figure 1. Measuring of RNAP interactions with derivatives of N25cons promoter using the RNAP beacon assay.
(A) Time dependence of the increase in fluorescence upon mixing 1 nM RNAP beacon with 2 nM indicated N25cons derivatives whose downstream ends were located between positions +3 to +21, 2 nM upstream fork junction or 2 nM non-promoter DNA probe.
(B, C) The effect of downstream end position on resistance of RNAP beacon complexes with truncated N25cons derivatives to heparin or [−58/−14] DNA competitor. Time-dependent changes of the fluorescence signal were measured upon the addition of either 20 μg/ml heparin (B) or 4 nM [−58/−14] (C) to RNAP beacon complexes with N25cons derivatives formed as in panel (A).
The structures of the DNA probes are shown in Table. S1 (probes 1-8, 13, 28, 33). The structure of non-promoter DNA probe is shown in Fig. S5. The numbers in the panels indicate positions of downstream edges of the probes, “+6 mismatched” in panel B refers to probe 13 with downstream end at +6 containing a mismatched segment spanning positions −3 to +1.

