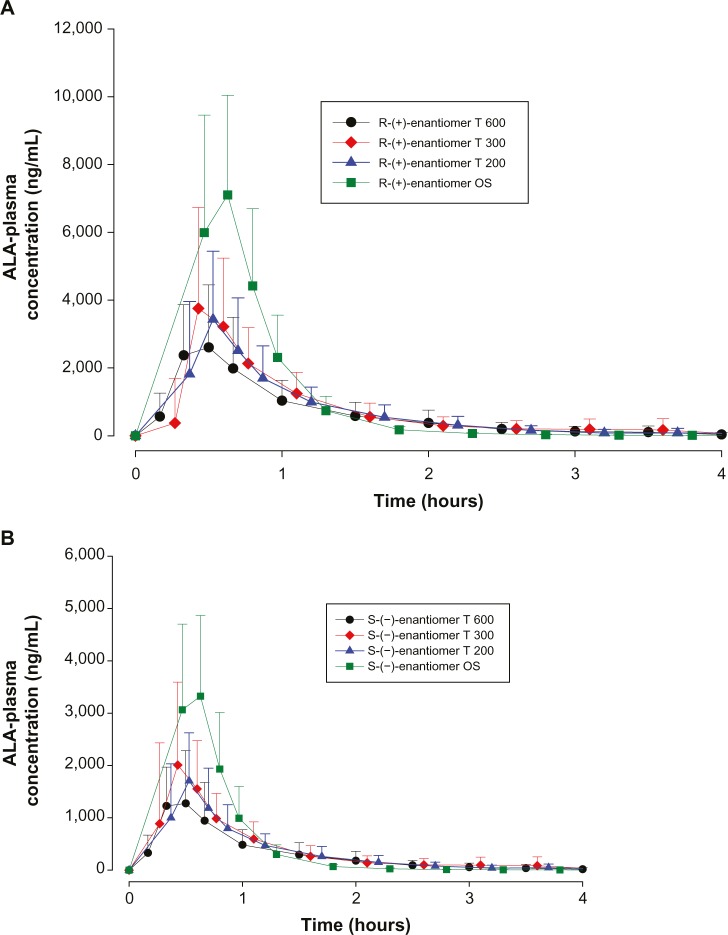
Figure 1.
ALA plasma concentration–time curves by treatment.
Notes: (A) Plasma concentration-time curves (means ± SD) of the R-(+)-ALA enantiomer by treatment; complete PK population. N=24 (12 males/12 females). (B) Plasma concentration-time curves (means ± SD) of the S-(−)-ALA enantiomer by treatment; complete PK population. N=24 (12 males/12 females).
Abbreviations: ALA, alpha-lipoic acid; T 600, 600 mg tablet; T 300, 300 mg tablet; T 200, 200 mg tablet; OS, orally administered ALA solution; SD, standard deviation; PK, pharmacokinetics; N, number.

