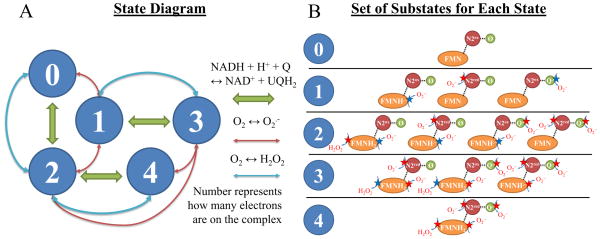
Figure 1. Model state diagram and ROS leak pathways.
A) The 5-state model is shown with green arrows representing the NADH + H+ + Q ↔ NAD+ + QH2 reaction, blue arrows representing O2 ↔ H2O2 reaction, and red arrows representing the O2 ↔ O2·− reaction. B) For each state, the substates and their possible ROS leak sites are shown as stars (right). Green stars signify the most relevant sites identified after model analysis.

